- Australia
- /
- Hospitality
- /
- ASX:BET
Investors ignore increasing losses at Betmakers Technology Group (ASX:BET) as stock jumps 14% this past week


When you buy a stock there is always a possibility that it could drop 100%. But on the bright side, you can make far more than 100% on a really good stock. One great example is Betmakers Technology Group Ltd (ASX:BET) which saw its share price drive 231% higher over five years. Also pleasing for shareholders was the 17% gain in the last three months.
The past week has proven to be lucrative for Betmakers Technology Group investors, so let's see if fundamentals drove the company's five-year performance.
See our latest analysis for Betmakers Technology Group
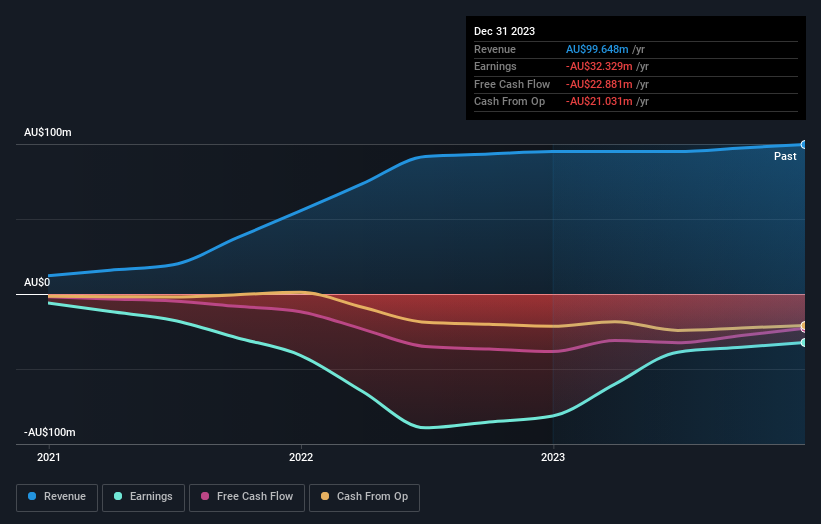
Betmakers Technology Group wasn't profitable in the last twelve months, it is unlikely we'll see a strong correlation between its share price and its earnings per share (EPS). Arguably revenue is our next best option. When a company doesn't make profits, we'd generally hope to see good revenue growth. That's because fast revenue growth can be easily extrapolated to forecast profits, often of considerable size.
In the last 5 years Betmakers Technology Group saw its revenue grow at 52% per year. That's well above most pre-profit companies. So it's not entirely surprising that the share price reflected this performance by increasing at a rate of 27% per year, in that time. This suggests the market has well and truly recognized the progress the business has made. Betmakers Technology Group seems like a high growth stock - so growth investors might want to add it to their watchlist.
The image below shows how earnings and revenue have tracked over time (if you click on the image you can see greater detail).
You can see how its balance sheet has strengthened (or weakened) over time in this free interactive graphic.
What About The Total Shareholder Return (TSR)?
Investors should note that there's a difference between Betmakers Technology Group's total shareholder return (TSR) and its share price change, which we've covered above. Arguably the TSR is a more complete return calculation because it accounts for the value of dividends (as if they were reinvested), along with the hypothetical value of any discounted capital that have been offered to shareholders. We note that Betmakers Technology Group's TSR, at 258% is higher than its share price return of 231%. When you consider it hasn't been paying a dividend, this data suggests shareholders have benefitted from a spin-off, or had the opportunity to acquire attractively priced shares in a discounted capital raising.
A Different Perspective
Investors in Betmakers Technology Group had a tough year, with a total loss of 42%, against a market gain of about 16%. However, keep in mind that even the best stocks will sometimes underperform the market over a twelve month period. On the bright side, long term shareholders have made money, with a gain of 29% per year over half a decade. If the fundamental data continues to indicate long term sustainable growth, the current sell-off could be an opportunity worth considering. It's always interesting to track share price performance over the longer term. But to understand Betmakers Technology Group better, we need to consider many other factors. For instance, we've identified 2 warning signs for Betmakers Technology Group (1 makes us a bit uncomfortable) that you should be aware of.
If you would prefer to check out another company -- one with potentially superior financials -- then do not miss this free list of companies that have proven they can grow earnings.
Please note, the market returns quoted in this article reflect the market weighted average returns of stocks that currently trade on Australian exchanges.
Valuation is complex, but we're here to simplify it.
Discover if Betmakers Technology Group might be undervalued or overvalued with our detailed analysis, featuring fair value estimates, potential risks, dividends, insider trades, and its financial condition.
Access Free AnalysisHave feedback on this article? Concerned about the content? Get in touch with us directly. Alternatively, email editorial-team (at) simplywallst.com.
This article by Simply Wall St is general in nature. We provide commentary based on historical data and analyst forecasts only using an unbiased methodology and our articles are not intended to be financial advice. It does not constitute a recommendation to buy or sell any stock, and does not take account of your objectives, or your financial situation. We aim to bring you long-term focused analysis driven by fundamental data. Note that our analysis may not factor in the latest price-sensitive company announcements or qualitative material. Simply Wall St has no position in any stocks mentioned.
About ASX:BET
Betmakers Technology Group
Develops and provides software, data, and analytics products for the B2B wagering market in Australia, New Zealand, the United States, the United Kingdom, Europe, and internationally.
Flawless balance sheet low.

