
Advertisement
- Australia
- /
- Food and Staples Retail
- /
- ASX:WOW
Woolworths Group Limited (ASX:WOW) Shares Could Be 49% Below Their Intrinsic Value Estimate
Key Insights
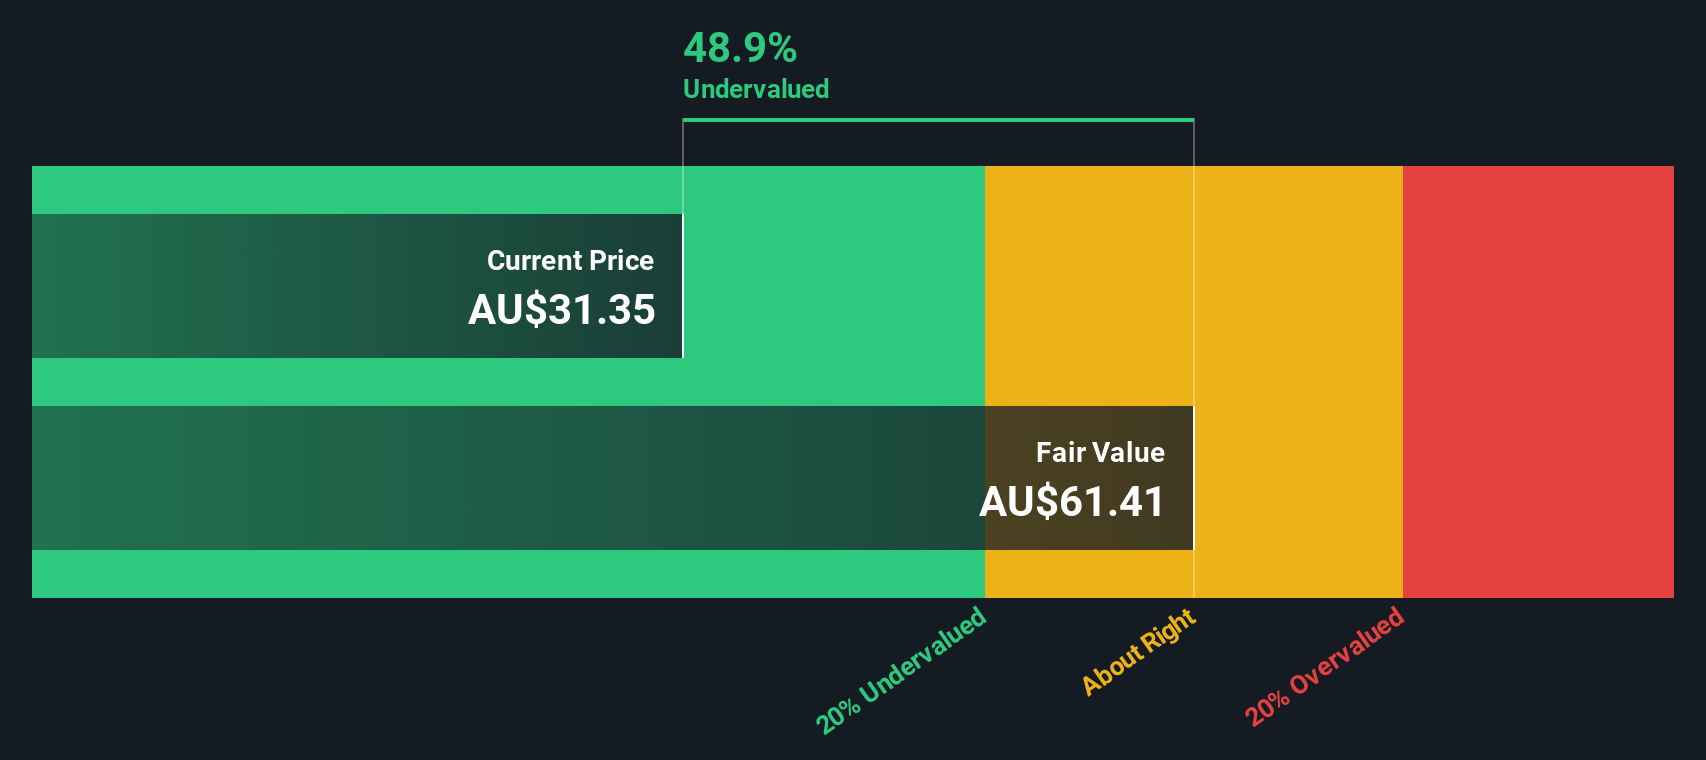
- Woolworths Group's estimated fair value is AU$61.41 based on 2 Stage Free Cash Flow to Equity
- Woolworths Group's AU$31.35 share price signals that it might be 49% undervalued
- Our fair value estimate is 89% higher than Woolworths Group's analyst price target of AU$32.48
How far off is Woolworths Group Limited (ASX:WOW) from its intrinsic value? Using the most recent financial data, we'll take a look at whether the stock is fairly priced by projecting its future cash flows and then discounting them to today's value. One way to achieve this is by employing the Discounted Cash Flow (DCF) model. Models like these may appear beyond the comprehension of a lay person, but they're fairly easy to follow.
Remember though, that there are many ways to estimate a company's value, and a DCF is just one method. If you want to learn more about discounted cash flow, the rationale behind this calculation can be read in detail in the Simply Wall St analysis model.
Crunching The Numbers
We're using the 2-stage growth model, which simply means we take in account two stages of company's growth. In the initial period the company may have a higher growth rate and the second stage is usually assumed to have a stable growth rate. In the first stage we need to estimate the cash flows to the business over the next ten years. Where possible we use analyst estimates, but when these aren't available we extrapolate the previous free cash flow (FCF) from the last estimate or reported value. We assume companies with shrinking free cash flow will slow their rate of shrinkage, and that companies with growing free cash flow will see their growth rate slow, over this period. We do this to reflect that growth tends to slow more in the early years than it does in later years.
A DCF is all about the idea that a dollar in the future is less valuable than a dollar today, so we discount the value of these future cash flows to their estimated value in today's dollars:
10-year free cash flow (FCF) estimate
| 2025 | 2026 | 2027 | 2028 | 2029 | 2030 | 2031 | 2032 | 2033 | 2034 | |
| Levered FCF (A$, Millions) | AU$2.18b | AU$2.75b | AU$3.03b | AU$3.25b | AU$3.44b | AU$3.61b | AU$3.77b | AU$3.91b | AU$4.06b | AU$4.20b |
| Growth Rate Estimate Source | Analyst x3 | Analyst x3 | Analyst x3 | Est @ 7.08% | Est @ 5.84% | Est @ 4.98% | Est @ 4.37% | Est @ 3.94% | Est @ 3.64% | Est @ 3.44% |
| Present Value (A$, Millions) Discounted @ 7.1% | AU$2.0k | AU$2.4k | AU$2.5k | AU$2.5k | AU$2.4k | AU$2.4k | AU$2.3k | AU$2.3k | AU$2.2k | AU$2.1k |
("Est" = FCF growth rate estimated by Simply Wall St)
Present Value of 10-year Cash Flow (PVCF) = AU$23b
The second stage is also known as Terminal Value, this is the business's cash flow after the first stage. The Gordon Growth formula is used to calculate Terminal Value at a future annual growth rate equal to the 5-year average of the 10-year government bond yield of 2.9%. We discount the terminal cash flows to today's value at a cost of equity of 7.1%.
Terminal Value (TV)= FCF2034 × (1 + g) ÷ (r – g) = AU$4.2b× (1 + 2.9%) ÷ (7.1%– 2.9%) = AU$103b
Present Value of Terminal Value (PVTV)= TV / (1 + r)10= AU$103b÷ ( 1 + 7.1%)10= AU$52b
The total value, or equity value, is then the sum of the present value of the future cash flows, which in this case is AU$75b. In the final step we divide the equity value by the number of shares outstanding. Relative to the current share price of AU$31.4, the company appears quite good value at a 49% discount to where the stock price trades currently. The assumptions in any calculation have a big impact on the valuation, so it is better to view this as a rough estimate, not precise down to the last cent.
The Assumptions
The calculation above is very dependent on two assumptions. The first is the discount rate and the other is the cash flows. You don't have to agree with these inputs, I recommend redoing the calculations yourself and playing with them. The DCF also does not consider the possible cyclicality of an industry, or a company's future capital requirements, so it does not give a full picture of a company's potential performance. Given that we are looking at Woolworths Group as potential shareholders, the cost of equity is used as the discount rate, rather than the cost of capital (or weighted average cost of capital, WACC) which accounts for debt. In this calculation we've used 7.1%, which is based on a levered beta of 0.965. Beta is a measure of a stock's volatility, compared to the market as a whole. We get our beta from the industry average beta of globally comparable companies, with an imposed limit between 0.8 and 2.0, which is a reasonable range for a stable business.
See our latest analysis for Woolworths Group
SWOT Analysis for Woolworths Group
Strength
- Debt is well covered by earnings and cashflows.
Weakness
- Dividend is low compared to the top 25% of dividend payers in the Consumer Retailing market.
Opportunity
- Annual earnings are forecast to grow for the next 3 years.
- Good value based on P/E ratio and estimated fair value.
Threat
- Dividends are not covered by cash flow.
- Annual earnings are forecast to grow slower than the Australian market.
Looking Ahead:
Valuation is only one side of the coin in terms of building your investment thesis, and it ideally won't be the sole piece of analysis you scrutinize for a company. The DCF model is not a perfect stock valuation tool. Instead the best use for a DCF model is to test certain assumptions and theories to see if they would lead to the company being undervalued or overvalued. For instance, if the terminal value growth rate is adjusted slightly, it can dramatically alter the overall result. Why is the intrinsic value higher than the current share price? For Woolworths Group, there are three fundamental elements you should assess:
- Risks: For example, we've discovered 3 warning signs for Woolworths Group that you should be aware of before investing here.
- Future Earnings: How does WOW's growth rate compare to its peers and the wider market? Dig deeper into the analyst consensus number for the upcoming years by interacting with our free analyst growth expectation chart.
- Other High Quality Alternatives: Do you like a good all-rounder? Explore our interactive list of high quality stocks to get an idea of what else is out there you may be missing!
PS. Simply Wall St updates its DCF calculation for every Australian stock every day, so if you want to find the intrinsic value of any other stock just search here.
Valuation is complex, but we're here to simplify it.
Discover if Woolworths Group might be undervalued or overvalued with our detailed analysis, featuring fair value estimates, potential risks, dividends, insider trades, and its financial condition.
Access Free AnalysisHave feedback on this article? Concerned about the content? Get in touch with us directly. Alternatively, email editorial-team (at) simplywallst.com.
This article by Simply Wall St is general in nature. We provide commentary based on historical data and analyst forecasts only using an unbiased methodology and our articles are not intended to be financial advice. It does not constitute a recommendation to buy or sell any stock, and does not take account of your objectives, or your financial situation. We aim to bring you long-term focused analysis driven by fundamental data. Note that our analysis may not factor in the latest price-sensitive company announcements or qualitative material. Simply Wall St has no position in any stocks mentioned.
About ASX:WOW
Moderate growth potential with acceptable track record.
Similar Companies
Market Insights

Advertisement
Community Narratives
MicroVision will explode future revenue by 380.37% with a vision towards success
Fair Value US$60.00|98.5% undervalued
TH
Community Contributor
The Indispensable Artery for a New North American Economy
Fair Value CA$132.87|2.3% undervalued
TI
Community Contributor