
Advertisement
- Australia
- /
- Consumer Durables
- /
- ASX:SIO
How Does Simonds Group's (ASX:SIO) P/E Compare To Its Industry, After Its Big Share Price Gain?
Simonds Group (ASX:SIO) shares have had a really impressive month, gaining 32%, after some slippage. While recent buyers might be laughing, long term holders might not be so pleased, since the recent gain only brings the full year return to evens.
All else being equal, a sharp share price increase should make a stock less attractive to potential investors. In the long term, share prices tend to follow earnings per share, but in the short term prices bounce around in response to short term factors (which are not always obvious). The implication here is that deep value investors might steer clear when expectations of a company are too high. One way to gauge market expectations of a stock is to look at its Price to Earnings Ratio (PE Ratio). A high P/E ratio means that investors have a high expectation about future growth, while a low P/E ratio means they have low expectations about future growth.
See our latest analysis for Simonds Group
Does Simonds Group Have A Relatively High Or Low P/E For Its Industry?
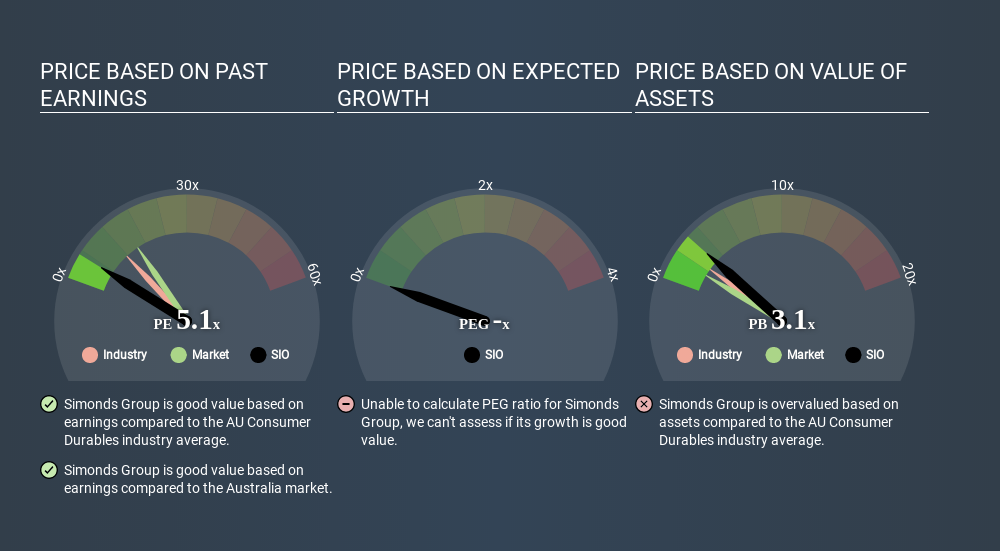
Simonds Group's P/E of 5.11 indicates relatively low sentiment towards the stock. The image below shows that Simonds Group has a lower P/E than the average (11.6) P/E for companies in the consumer durables industry.
Its relatively low P/E ratio indicates that Simonds Group shareholders think it will struggle to do as well as other companies in its industry classification. Since the market seems unimpressed with Simonds Group, it's quite possible it could surprise on the upside. If you consider the stock interesting, further research is recommended. For example, I often monitor director buying and selling.
How Growth Rates Impact P/E Ratios
P/E ratios primarily reflect market expectations around earnings growth rates. When earnings grow, the 'E' increases, over time. Therefore, even if you pay a high multiple of earnings now, that multiple will become lower in the future. So while a stock may look expensive based on past earnings, it could be cheap based on future earnings.
Simonds Group saw earnings per share decrease by 8.6% last year.
A Limitation: P/E Ratios Ignore Debt and Cash In The Bank
Don't forget that the P/E ratio considers market capitalization. That means it doesn't take debt or cash into account. Hypothetically, a company could reduce its future P/E ratio by spending its cash (or taking on debt) to achieve higher earnings.
While growth expenditure doesn't always pay off, the point is that it is a good option to have; but one that the P/E ratio ignores.
Is Debt Impacting Simonds Group's P/E?
With net cash of AU$13m, Simonds Group has a very strong balance sheet, which may be important for its business. Having said that, at 28% of its market capitalization the cash hoard would contribute towards a higher P/E ratio.
The Verdict On Simonds Group's P/E Ratio
Simonds Group trades on a P/E ratio of 5.1, which is below the AU market average of 15.5. Falling earnings per share are likely to be keeping potential buyers away, the relatively strong balance sheet will allow the company time to invest in growth. If it achieves that, then there's real potential that the low P/E could eventually indicate undervaluation. What is very clear is that the market has become less pessimistic about Simonds Group over the last month, with the P/E ratio rising from 3.9 back then to 5.1 today. If you like to buy stocks that could be turnaround opportunities, then this one might be a candidate; but if you're more sensitive to price, then you may feel the opportunity has passed.
When the market is wrong about a stock, it gives savvy investors an opportunity. As value investor Benjamin Graham famously said, 'In the short run, the market is a voting machine but in the long run, it is a weighing machine. We don't have analyst forecasts, but shareholders might want to examine this detailed historical graph of earnings, revenue and cash flow.
Of course, you might find a fantastic investment by looking at a few good candidates. So take a peek at this free list of companies with modest (or no) debt, trading on a P/E below 20.
Love or hate this article? Concerned about the content? Get in touch with us directly. Alternatively, email editorial-team@simplywallst.com.
This article by Simply Wall St is general in nature. It does not constitute a recommendation to buy or sell any stock, and does not take account of your objectives, or your financial situation. We aim to bring you long-term focused analysis driven by fundamental data. Note that our analysis may not factor in the latest price-sensitive company announcements or qualitative material. Simply Wall St has no position in any stocks mentioned. Thank you for reading.
About ASX:SIO
Simonds Group
Designs, constructs, and sells residential dwellings in Australia.
Mediocre balance sheet and slightly overvalued.
Similar Companies
Market Insights

Advertisement
Community Narratives
The company that turned a verb into a global necessity and basically runs the modern internet, digital ads, smartphones, maps, and AI.
Fair Value US$300.00|5.2% undervalued
OS
Community Contributor
Flowers Foods Pays A Fair Price For Health
Fair Value US$16.12|24.9% undervalued
NV
Community Contributor
TMX Group will thrive with 33.3% profit margin and enduring market moat
Fair Value CA$49.90|3.3% overvalued
LI
Community Contributor
The "Molecular Pencil": Why Beam's Technology is Built to Win
Fair Value US$65.01|64.5% undervalued
DA
Community Contributor