
Advertisement
- Australia
- /
- Professional Services
- /
- ASX:KPG
Most Shareholders Will Probably Find That The CEO Compensation For Kelly Partners Group Holdings Limited (ASX:KPG) Is Reasonable
Performance at Kelly Partners Group Holdings Limited (ASX:KPG) has been reasonably good and CEO Brett Kelly has done a decent job of steering the company in the right direction. In light of this performance, CEO compensation will probably not be the main focus for shareholders as they go into the AGM on 07 October 2021. Here is our take on why we think the CEO compensation looks appropriate.
See our latest analysis for Kelly Partners Group Holdings
Comparing Kelly Partners Group Holdings Limited's CEO Compensation With the industry
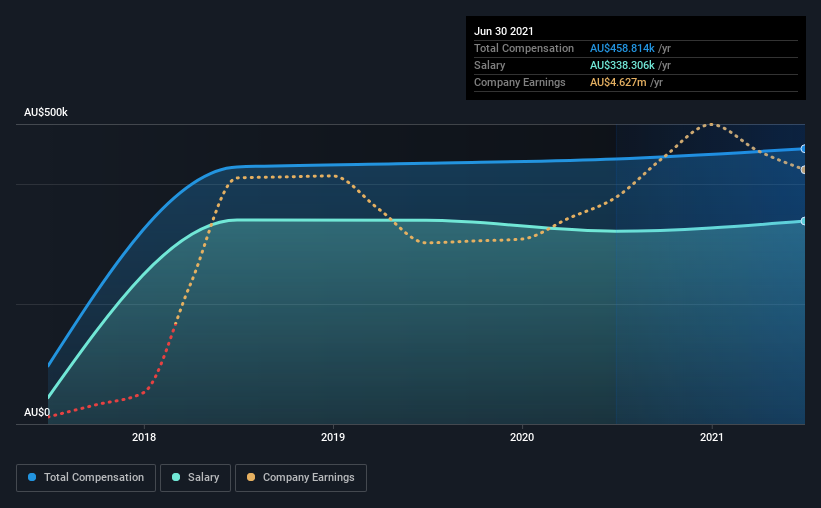
According to our data, Kelly Partners Group Holdings Limited has a market capitalization of AU$150m, and paid its CEO total annual compensation worth AU$459k over the year to June 2021. That's just a smallish increase of 3.9% on last year. Notably, the salary which is AU$338.3k, represents most of the total compensation being paid.
For comparison, other companies in the industry with market capitalizations below AU$276m, reported a median total CEO compensation of AU$388k. From this we gather that Brett Kelly is paid around the median for CEOs in the industry. Furthermore, Brett Kelly directly owns AU$76m worth of shares in the company, implying that they are deeply invested in the company's success.
| Component | 2021 | 2020 | Proportion (2021) |
| Salary | AU$338k | AU$321k | 74% |
| Other | AU$121k | AU$120k | 26% |
| Total Compensation | AU$459k | AU$442k | 100% |
On an industry level, around 76% of total compensation represents salary and 24% is other remuneration. Our data reveals that Kelly Partners Group Holdings allocates salary more or less in line with the wider market. If salary is the major component in total compensation, it suggests that the CEO receives a higher fixed proportion of the total compensation, regardless of performance.
A Look at Kelly Partners Group Holdings Limited's Growth Numbers
Kelly Partners Group Holdings Limited's earnings per share (EPS) grew 2.2% per year over the last three years. In the last year, its revenue is up 7.5%.
We're not particularly impressed by the revenue growth, but it is good to see modest EPS growth. So there are some positives here, but not enough to earn high praise. Historical performance can sometimes be a good indicator on what's coming up next but if you want to peer into the company's future you might be interested in this free visualization of analyst forecasts.
Has Kelly Partners Group Holdings Limited Been A Good Investment?
Boasting a total shareholder return of 204% over three years, Kelly Partners Group Holdings Limited has done well by shareholders. So they may not be at all concerned if the CEO were to be paid more than is normal for companies around the same size.
In Summary...
Seeing that the company has put up a decent performance, only a few shareholders, if any at all, might have questions about the CEO pay in the upcoming AGM. Despite the pleasing results, we still think that any proposed increases to CEO compensation will be examined based on a case by case basis and linked to performance outcomes.
While CEO pay is an important factor to be aware of, there are other areas that investors should be mindful of as well. We've identified 1 warning sign for Kelly Partners Group Holdings that investors should be aware of in a dynamic business environment.
Important note: Kelly Partners Group Holdings is an exciting stock, but we understand investors may be looking for an unencumbered balance sheet and blockbuster returns. You might find something better in this list of interesting companies with high ROE and low debt.
Valuation is complex, but we're here to simplify it.
Discover if Kelly Partners Group Holdings might be undervalued or overvalued with our detailed analysis, featuring fair value estimates, potential risks, dividends, insider trades, and its financial condition.
Access Free AnalysisThis article by Simply Wall St is general in nature. We provide commentary based on historical data and analyst forecasts only using an unbiased methodology and our articles are not intended to be financial advice. It does not constitute a recommendation to buy or sell any stock, and does not take account of your objectives, or your financial situation. We aim to bring you long-term focused analysis driven by fundamental data. Note that our analysis may not factor in the latest price-sensitive company announcements or qualitative material. Simply Wall St has no position in any stocks mentioned.
Have feedback on this article? Concerned about the content? Get in touch with us directly. Alternatively, email editorial-team (at) simplywallst.com.
About ASX:KPG
Kelly Partners Group Holdings
Provides chartered accounting and other professional services to private businesses and high net worth individuals in Australia and internationally.
Slightly overvalued with questionable track record.
Market Insights

Advertisement
Community Narratives
The company that turned a verb into a global necessity and basically runs the modern internet, digital ads, smartphones, maps, and AI.
Fair Value US$300.00|6.3% undervalued
OS
Community Contributor
Flowers Foods Pays A Fair Price For Health
Fair Value US$16.12|26.0% undervalued
NV
Community Contributor
TMX Group will thrive with 33.3% profit margin and enduring market moat
Fair Value CA$49.90|3.7% overvalued
LI
Community Contributor