
Advertisement
David Iben put it well when he said, 'Volatility is not a risk we care about. What we care about is avoiding the permanent loss of capital.' When we think about how risky a company is, we always like to look at its use of debt, since debt overload can lead to ruin. As with many other companies AMA Group Limited (ASX:AMA) makes use of debt. But the real question is whether this debt is making the company risky.
Why Does Debt Bring Risk?
Debt and other liabilities become risky for a business when it cannot easily fulfill those obligations, either with free cash flow or by raising capital at an attractive price. If things get really bad, the lenders can take control of the business. While that is not too common, we often do see indebted companies permanently diluting shareholders because lenders force them to raise capital at a distressed price. Of course, plenty of companies use debt to fund growth, without any negative consequences. When we examine debt levels, we first consider both cash and debt levels, together.
Check out our latest analysis for AMA Group
How Much Debt Does AMA Group Carry?
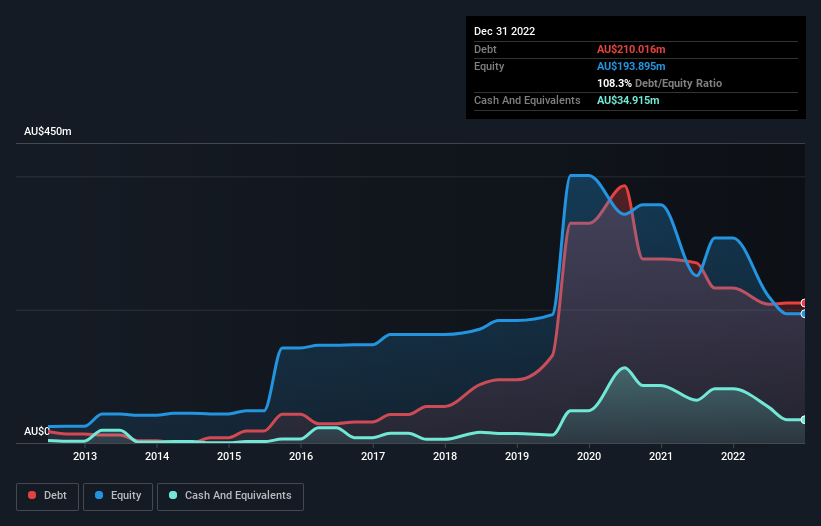
The image below, which you can click on for greater detail, shows that AMA Group had debt of AU$210.0m at the end of December 2022, a reduction from AU$232.5m over a year. However, it does have AU$34.9m in cash offsetting this, leading to net debt of about AU$175.1m.
How Healthy Is AMA Group's Balance Sheet?
According to the last reported balance sheet, AMA Group had liabilities of AU$179.0m due within 12 months, and liabilities of AU$551.4m due beyond 12 months. Offsetting these obligations, it had cash of AU$34.9m as well as receivables valued at AU$54.0m due within 12 months. So its liabilities total AU$641.5m more than the combination of its cash and short-term receivables.
The deficiency here weighs heavily on the AU$123.4m company itself, as if a child were struggling under the weight of an enormous back-pack full of books, his sports gear, and a trumpet. So we'd watch its balance sheet closely, without a doubt. After all, AMA Group would likely require a major re-capitalisation if it had to pay its creditors today. The balance sheet is clearly the area to focus on when you are analysing debt. But it is future earnings, more than anything, that will determine AMA Group's ability to maintain a healthy balance sheet going forward. So if you're focused on the future you can check out this free report showing analyst profit forecasts.
In the last year AMA Group had a loss before interest and tax, and actually shrunk its revenue by 5.5%, to AU$853m. That's not what we would hope to see.
Caveat Emptor
Importantly, AMA Group had an earnings before interest and tax (EBIT) loss over the last year. Indeed, it lost a very considerable AU$38m at the EBIT level. If you consider the significant liabilities mentioned above, we are extremely wary of this investment. That said, it is possible that the company will turn its fortunes around. Nevertheless, we would not bet on it given that it vaporized AU$17m in cash over the last twelve months, and it doesn't have much by way of liquid assets. So we think this stock is risky, like walking through a dirty dog park with a mask on. The balance sheet is clearly the area to focus on when you are analysing debt. However, not all investment risk resides within the balance sheet - far from it. To that end, you should learn about the 4 warning signs we've spotted with AMA Group (including 1 which is significant) .
If, after all that, you're more interested in a fast growing company with a rock-solid balance sheet, then check out our list of net cash growth stocks without delay.
New: Manage All Your Stock Portfolios in One Place
We've created the ultimate portfolio companion for stock investors, and it's free.
• Connect an unlimited number of Portfolios and see your total in one currency
• Be alerted to new Warning Signs or Risks via email or mobile
• Track the Fair Value of your stocks
Have feedback on this article? Concerned about the content? Get in touch with us directly. Alternatively, email editorial-team (at) simplywallst.com.
This article by Simply Wall St is general in nature. We provide commentary based on historical data and analyst forecasts only using an unbiased methodology and our articles are not intended to be financial advice. It does not constitute a recommendation to buy or sell any stock, and does not take account of your objectives, or your financial situation. We aim to bring you long-term focused analysis driven by fundamental data. Note that our analysis may not factor in the latest price-sensitive company announcements or qualitative material. Simply Wall St has no position in any stocks mentioned.
About ASX:AMA
AMA Group
Engages in the development and operation of collision repair business in Australia and New Zealand.
Very undervalued with adequate balance sheet.
Similar Companies
Market Insights

Advertisement
Community Narratives
The company that turned a verb into a global necessity and basically runs the modern internet, digital ads, smartphones, maps, and AI.
Fair Value US$300.00|7.1% undervalued
OS
Community Contributor
Flowers Foods Pays A Fair Price For Health
Fair Value US$16.12|26.4% undervalued
NV
Community Contributor
TMX Group will thrive with 33.3% profit margin and enduring market moat
Fair Value CA$49.90|0.8% overvalued
LI
Community Contributor
The "Molecular Pencil": Why Beam's Technology is Built to Win
Fair Value US$65.01|65.8% undervalued
DA
Community Contributor