
Advertisement
- Australia
- /
- Electrical
- /
- ASX:MYG
Investors Appear Satisfied With Mayfield Group Holdings Limited's (ASX:MYG) Prospects As Shares Rocket 28%
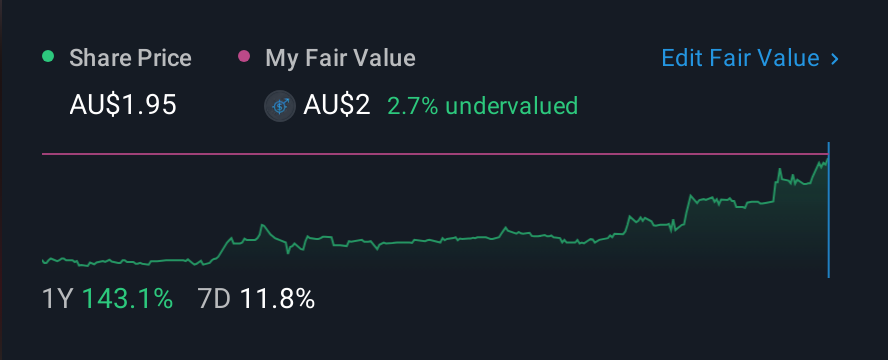
Mayfield Group Holdings Limited (ASX:MYG) shareholders have had their patience rewarded with a 28% share price jump in the last month. The last 30 days bring the annual gain to a very sharp 55%.
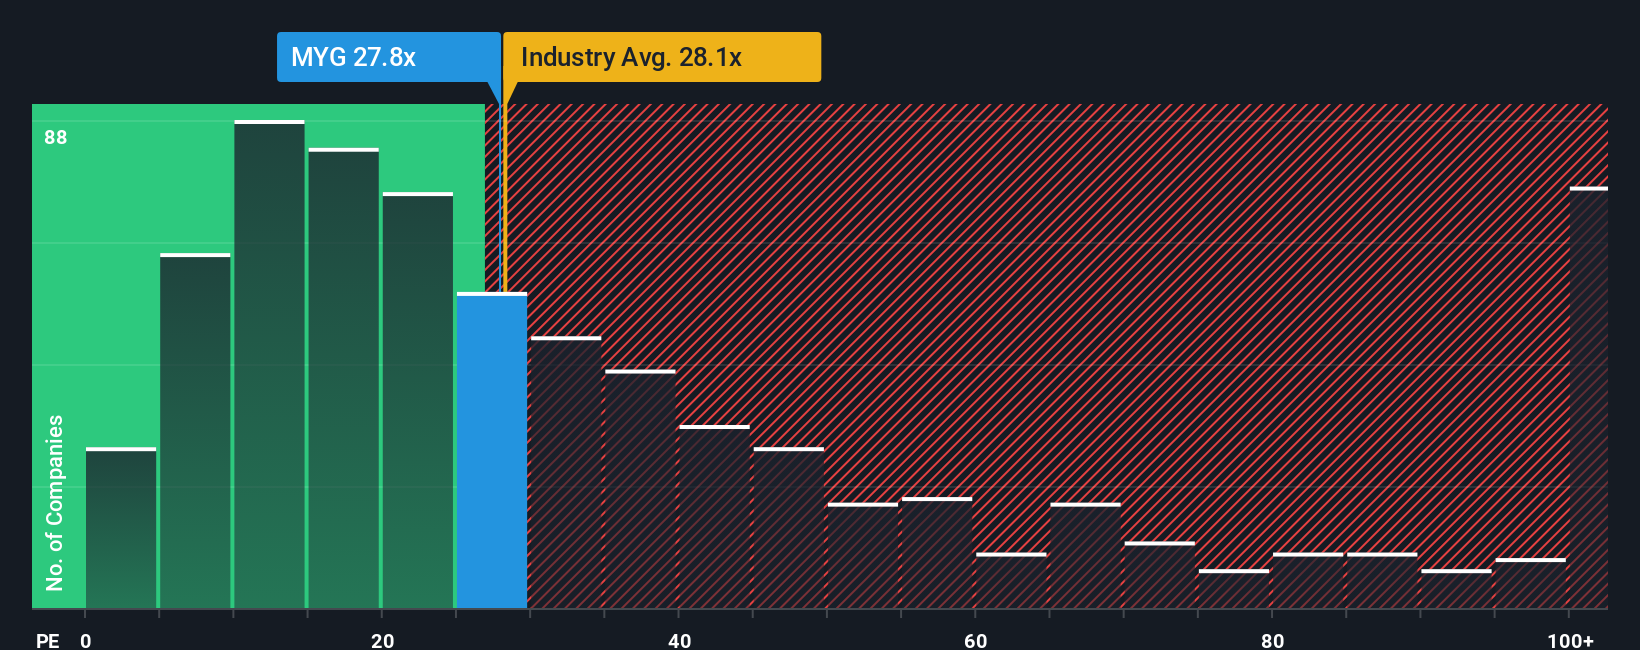
After such a large jump in price, Mayfield Group Holdings' price-to-earnings (or "P/E") ratio of 27.8x might make it look like a sell right now compared to the market in Australia, where around half of the companies have P/E ratios below 18x and even P/E's below 11x are quite common. Although, it's not wise to just take the P/E at face value as there may be an explanation why it's as high as it is.
For instance, Mayfield Group Holdings' receding earnings in recent times would have to be some food for thought. It might be that many expect the company to still outplay most other companies over the coming period, which has kept the P/E from collapsing. If not, then existing shareholders may be quite nervous about the viability of the share price.
View our latest analysis for Mayfield Group Holdings
Does Growth Match The High P/E?
There's an inherent assumption that a company should outperform the market for P/E ratios like Mayfield Group Holdings' to be considered reasonable.
If we review the last year of earnings, dishearteningly the company's profits fell to the tune of 41%. However, a few very strong years before that means that it was still able to grow EPS by an impressive 1,198% in total over the last three years. So we can start by confirming that the company has generally done a very good job of growing earnings over that time, even though it had some hiccups along the way.
Comparing that to the market, which is only predicted to deliver 20% growth in the next 12 months, the company's momentum is stronger based on recent medium-term annualised earnings results.
With this information, we can see why Mayfield Group Holdings is trading at such a high P/E compared to the market. Presumably shareholders aren't keen to offload something they believe will continue to outmanoeuvre the bourse.
What We Can Learn From Mayfield Group Holdings' P/E?
Mayfield Group Holdings' P/E is getting right up there since its shares have risen strongly. We'd say the price-to-earnings ratio's power isn't primarily as a valuation instrument but rather to gauge current investor sentiment and future expectations.
We've established that Mayfield Group Holdings maintains its high P/E on the strength of its recent three-year growth being higher than the wider market forecast, as expected. At this stage investors feel the potential for a deterioration in earnings isn't great enough to justify a lower P/E ratio. Unless the recent medium-term conditions change, they will continue to provide strong support to the share price.
We don't want to rain on the parade too much, but we did also find 2 warning signs for Mayfield Group Holdings that you need to be mindful of.
Of course, you might also be able to find a better stock than Mayfield Group Holdings. So you may wish to see this free collection of other companies that have reasonable P/E ratios and have grown earnings strongly.
New: Manage All Your Stock Portfolios in One Place
We've created the ultimate portfolio companion for stock investors, and it's free.
• Connect an unlimited number of Portfolios and see your total in one currency
• Be alerted to new Warning Signs or Risks via email or mobile
• Track the Fair Value of your stocks
Have feedback on this article? Concerned about the content? Get in touch with us directly. Alternatively, email editorial-team (at) simplywallst.com.
This article by Simply Wall St is general in nature. We provide commentary based on historical data and analyst forecasts only using an unbiased methodology and our articles are not intended to be financial advice. It does not constitute a recommendation to buy or sell any stock, and does not take account of your objectives, or your financial situation. We aim to bring you long-term focused analysis driven by fundamental data. Note that our analysis may not factor in the latest price-sensitive company announcements or qualitative material. Simply Wall St has no position in any stocks mentioned.
About ASX:MYG
Mayfield Group Holdings
Provides electrical and telecommunications infrastructure products and services in Australia.
Flawless balance sheet with reasonable growth potential.
Market Insights

Advertisement
Community Narratives
The company that turned a verb into a global necessity and basically runs the modern internet, digital ads, smartphones, maps, and AI.
Fair Value US$300.00|6.3% undervalued
OS
Community Contributor
Flowers Foods Pays A Fair Price For Health
Fair Value US$16.12|26.0% undervalued
NV
Community Contributor
TMX Group will thrive with 33.3% profit margin and enduring market moat
Fair Value CA$49.90|3.7% overvalued
LI
Community Contributor