
Advertisement
There are a few key trends to look for if we want to identify the next multi-bagger. Firstly, we'd want to identify a growing return on capital employed (ROCE) and then alongside that, an ever-increasing base of capital employed. Ultimately, this demonstrates that it's a business that is reinvesting profits at increasing rates of return. So when we looked at the ROCE trend of AJ Lucas Group (ASX:AJL) we really liked what we saw.
Return On Capital Employed (ROCE): What Is It?
Just to clarify if you're unsure, ROCE is a metric for evaluating how much pre-tax income (in percentage terms) a company earns on the capital invested in its business. Analysts use this formula to calculate it for AJ Lucas Group:
Return on Capital Employed = Earnings Before Interest and Tax (EBIT) ÷ (Total Assets - Current Liabilities)
0.39 = AU$12m ÷ (AU$107m - AU$76m) (Based on the trailing twelve months to December 2023).
Therefore, AJ Lucas Group has an ROCE of 39%. In absolute terms that's a great return and it's even better than the Construction industry average of 14%.
View our latest analysis for AJ Lucas Group
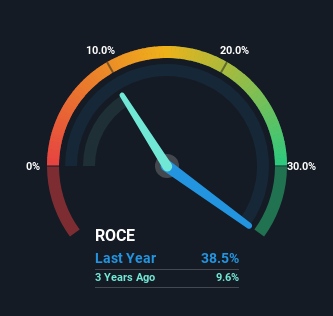
While the past is not representative of the future, it can be helpful to know how a company has performed historically, which is why we have this chart above. If you'd like to look at how AJ Lucas Group has performed in the past in other metrics, you can view this free graph of AJ Lucas Group's past earnings, revenue and cash flow.
The Trend Of ROCE
We're pretty happy with how the ROCE has been trending at AJ Lucas Group. The figures show that over the last five years, returns on capital have grown by 315%. That's not bad because this tells for every dollar invested (capital employed), the company is increasing the amount earned from that dollar. In regards to capital employed, AJ Lucas Group appears to been achieving more with less, since the business is using 85% less capital to run its operation. AJ Lucas Group may be selling some assets so it's worth investigating if the business has plans for future investments to increase returns further still.
For the record though, there was a noticeable increase in the company's current liabilities over the period, so we would attribute some of the ROCE growth to that. Effectively this means that suppliers or short-term creditors are now funding 71% of the business, which is more than it was five years ago. Given it's pretty high ratio, we'd remind investors that having current liabilities at those levels can bring about some risks in certain businesses.
The Bottom Line
In the end, AJ Lucas Group has proven it's capital allocation skills are good with those higher returns from less amount of capital. However the stock is down a substantial 94% in the last five years so there could be other areas of the business hurting its prospects. Regardless, we think the underlying fundamentals warrant this stock for further investigation.
If you want to know some of the risks facing AJ Lucas Group we've found 4 warning signs (3 shouldn't be ignored!) that you should be aware of before investing here.
If you want to search for more stocks that have been earning high returns, check out this free list of stocks with solid balance sheets that are also earning high returns on equity.
New: Manage All Your Stock Portfolios in One Place
We've created the ultimate portfolio companion for stock investors, and it's free.
• Connect an unlimited number of Portfolios and see your total in one currency
• Be alerted to new Warning Signs or Risks via email or mobile
• Track the Fair Value of your stocks
Have feedback on this article? Concerned about the content? Get in touch with us directly. Alternatively, email editorial-team (at) simplywallst.com.
This article by Simply Wall St is general in nature. We provide commentary based on historical data and analyst forecasts only using an unbiased methodology and our articles are not intended to be financial advice. It does not constitute a recommendation to buy or sell any stock, and does not take account of your objectives, or your financial situation. We aim to bring you long-term focused analysis driven by fundamental data. Note that our analysis may not factor in the latest price-sensitive company announcements or qualitative material. Simply Wall St has no position in any stocks mentioned.
About ASX:AJL
Slight risk and slightly overvalued.
Similar Companies
Market Insights

Advertisement
Community Narratives
The company that turned a verb into a global necessity and basically runs the modern internet, digital ads, smartphones, maps, and AI.
Fair Value US$300.00|5.2% undervalued
OS
Community Contributor
Flowers Foods Pays A Fair Price For Health
Fair Value US$16.12|24.9% undervalued
NV
Community Contributor
TMX Group will thrive with 33.3% profit margin and enduring market moat
Fair Value CA$49.90|3.3% overvalued
LI
Community Contributor
The "Molecular Pencil": Why Beam's Technology is Built to Win
Fair Value US$65.01|64.5% undervalued
DA
Community Contributor