Stock Analysis
- Austria
- /
- Oil and Gas
- /
- WBAG:OMV
OMV's (VIE:OMV) earnings growth rate lags the 21% CAGR delivered to shareholders


You can receive the average market return by buying a low-cost index fund. But if you pick the right individual stocks, you could make more than that. Notably, the OMV Aktiengesellschaft (VIE:OMV) share price has gained 36% in three years, which is better than the average market return. Zooming in, the stock is up just 2.0% in the last year.
In light of the stock dropping 5.3% in the past week, we want to investigate the longer term story, and see if fundamentals have been the driver of the company's positive three-year return.
See our latest analysis for OMV
While the efficient markets hypothesis continues to be taught by some, it has been proven that markets are over-reactive dynamic systems, and investors are not always rational. By comparing earnings per share (EPS) and share price changes over time, we can get a feel for how investor attitudes to a company have morphed over time.
OMV was able to grow its EPS at 44% per year over three years, sending the share price higher. This EPS growth is higher than the 11% average annual increase in the share price. So it seems investors have become more cautious about the company, over time. This cautious sentiment is reflected in its (fairly low) P/E ratio of 3.81.
You can see how EPS has changed over time in the image below (click on the chart to see the exact values).
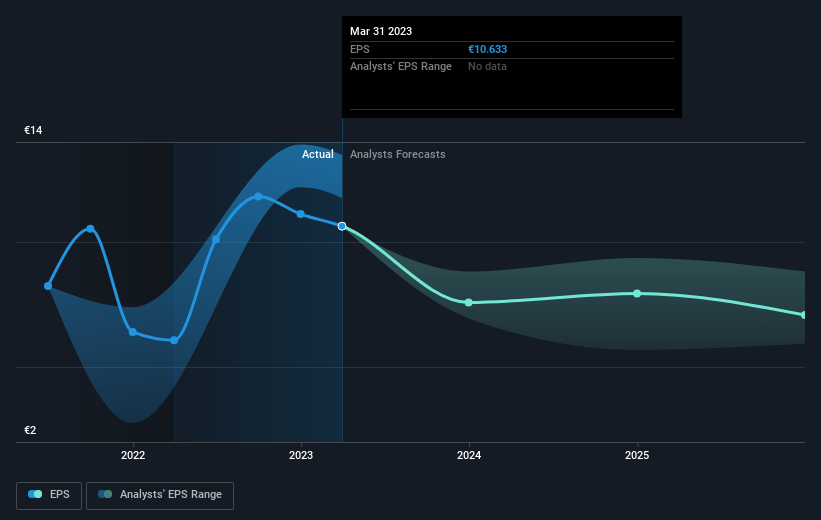
We're pleased to report that the CEO is remunerated more modestly than most CEOs at similarly capitalized companies. But while CEO remuneration is always worth checking, the really important question is whether the company can grow earnings going forward. Before buying or selling a stock, we always recommend a close examination of historic growth trends, available here..
What About Dividends?
When looking at investment returns, it is important to consider the difference between total shareholder return (TSR) and share price return. The TSR is a return calculation that accounts for the value of cash dividends (assuming that any dividend received was reinvested) and the calculated value of any discounted capital raisings and spin-offs. It's fair to say that the TSR gives a more complete picture for stocks that pay a dividend. We note that for OMV the TSR over the last 3 years was 79%, which is better than the share price return mentioned above. This is largely a result of its dividend payments!
A Different Perspective
We're pleased to report that OMV shareholders have received a total shareholder return of 15% over one year. That's including the dividend. That's better than the annualised return of 4% over half a decade, implying that the company is doing better recently. Someone with an optimistic perspective could view the recent improvement in TSR as indicating that the business itself is getting better with time. I find it very interesting to look at share price over the long term as a proxy for business performance. But to truly gain insight, we need to consider other information, too. Case in point: We've spotted 3 warning signs for OMV you should be aware of, and 1 of them is significant.
We will like OMV better if we see some big insider buys. While we wait, check out this free list of growing companies with considerable, recent, insider buying.
Please note, the market returns quoted in this article reflect the market weighted average returns of stocks that currently trade on Austrian exchanges.
Valuation is complex, but we're helping make it simple.
Find out whether OMV is potentially over or undervalued by checking out our comprehensive analysis, which includes fair value estimates, risks and warnings, dividends, insider transactions and financial health.
View the Free AnalysisHave feedback on this article? Concerned about the content? Get in touch with us directly. Alternatively, email editorial-team (at) simplywallst.com.
This article by Simply Wall St is general in nature. We provide commentary based on historical data and analyst forecasts only using an unbiased methodology and our articles are not intended to be financial advice. It does not constitute a recommendation to buy or sell any stock, and does not take account of your objectives, or your financial situation. We aim to bring you long-term focused analysis driven by fundamental data. Note that our analysis may not factor in the latest price-sensitive company announcements or qualitative material. Simply Wall St has no position in any stocks mentioned.
About WBAG:OMV
OMV
Operates as an energy and chemicals company in Austria, Germany, Romania, Norway, Belgium, New Zealand, the United Arab Emirates, the rest of Central and Eastern Europe, the rest of Europe, and internationally.
Flawless balance sheet, good value and pays a dividend.
