Stock Analysis
- United Arab Emirates
- /
- Real Estate
- /
- DFM:EMAARDEV
The total return for Emaar Development PJSC (DFM:EMAARDEV) investors has risen faster than earnings growth over the last three years


The most you can lose on any stock (assuming you don't use leverage) is 100% of your money. But in contrast you can make much more than 100% if the company does well. For example, the Emaar Development PJSC (DFM:EMAARDEV) share price has soared 118% in the last three years. Most would be happy with that. On top of that, the share price is up 17% in about a quarter.
Since the long term performance has been good but there's been a recent pullback of 3.8%, let's check if the fundamentals match the share price.
See our latest analysis for Emaar Development PJSC
There is no denying that markets are sometimes efficient, but prices do not always reflect underlying business performance. One imperfect but simple way to consider how the market perception of a company has shifted is to compare the change in the earnings per share (EPS) with the share price movement.
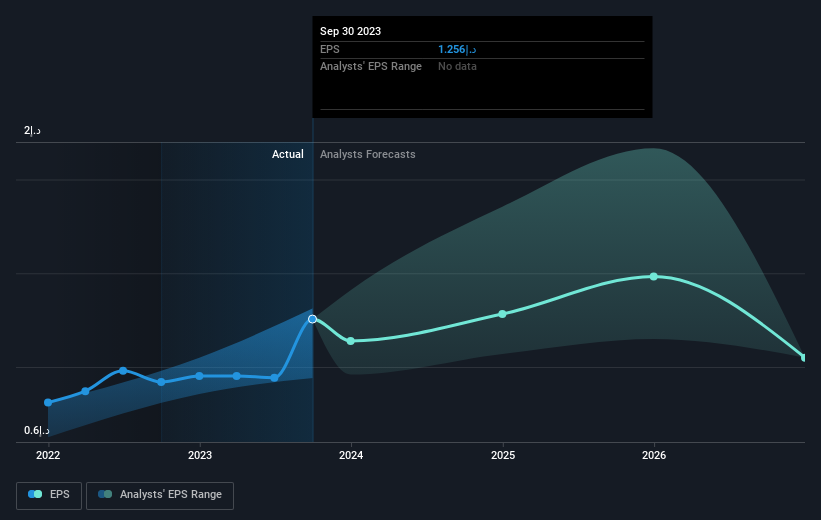
Emaar Development PJSC was able to grow its EPS at 36% per year over three years, sending the share price higher. The average annual share price increase of 30% is actually lower than the EPS growth. Therefore, it seems the market has moderated its expectations for growth, somewhat. This cautious sentiment is reflected in its (fairly low) P/E ratio of 5.28.
You can see below how EPS has changed over time (discover the exact values by clicking on the image).
We know that Emaar Development PJSC has improved its bottom line over the last three years, but what does the future have in store? If you are thinking of buying or selling Emaar Development PJSC stock, you should check out this FREE detailed report on its balance sheet.
What About Dividends?
It is important to consider the total shareholder return, as well as the share price return, for any given stock. Whereas the share price return only reflects the change in the share price, the TSR includes the value of dividends (assuming they were reinvested) and the benefit of any discounted capital raising or spin-off. Arguably, the TSR gives a more comprehensive picture of the return generated by a stock. We note that for Emaar Development PJSC the TSR over the last 3 years was 138%, which is better than the share price return mentioned above. This is largely a result of its dividend payments!
A Different Perspective
It's good to see that Emaar Development PJSC has rewarded shareholders with a total shareholder return of 64% in the last twelve months. That's including the dividend. Since the one-year TSR is better than the five-year TSR (the latter coming in at 15% per year), it would seem that the stock's performance has improved in recent times. Given the share price momentum remains strong, it might be worth taking a closer look at the stock, lest you miss an opportunity. It's always interesting to track share price performance over the longer term. But to understand Emaar Development PJSC better, we need to consider many other factors. To that end, you should be aware of the 1 warning sign we've spotted with Emaar Development PJSC .
Of course, you might find a fantastic investment by looking elsewhere. So take a peek at this free list of companies we expect will grow earnings.
Please note, the market returns quoted in this article reflect the market weighted average returns of stocks that currently trade on Emirian exchanges.
Valuation is complex, but we're helping make it simple.
Find out whether Emaar Development PJSC is potentially over or undervalued by checking out our comprehensive analysis, which includes fair value estimates, risks and warnings, dividends, insider transactions and financial health.
View the Free AnalysisHave feedback on this article? Concerned about the content? Get in touch with us directly. Alternatively, email editorial-team (at) simplywallst.com.
This article by Simply Wall St is general in nature. We provide commentary based on historical data and analyst forecasts only using an unbiased methodology and our articles are not intended to be financial advice. It does not constitute a recommendation to buy or sell any stock, and does not take account of your objectives, or your financial situation. We aim to bring you long-term focused analysis driven by fundamental data. Note that our analysis may not factor in the latest price-sensitive company announcements or qualitative material. Simply Wall St has no position in any stocks mentioned.
About DFM:EMAARDEV
Emaar Development PJSC
Develops and sells residential and commercial build-to-sell properties in the United Arab Emirates.
Outstanding track record with flawless balance sheet.
