Stock Analysis
- United Arab Emirates
- /
- Banks
- /
- DFM:DIB
The total return for Dubai Islamic Bank P.J.S.C (DFM:DIB) investors has risen faster than earnings growth over the last three years


Investors can buy low cost index fund if they want to receive the average market return. But in any diversified portfolio of stocks, you'll see some that fall short of the average. That's what has happened with the Dubai Islamic Bank P.J.S.C. (DFM:DIB) share price. It's up 34% over three years, but that is below the market return. Zooming in, the stock is actually down 8.6% in the last year.
While the stock has fallen 5.0% this week, it's worth focusing on the longer term and seeing if the stocks historical returns have been driven by the underlying fundamentals.
Check out our latest analysis for Dubai Islamic Bank P.J.S.C
To paraphrase Benjamin Graham: Over the short term the market is a voting machine, but over the long term it's a weighing machine. One flawed but reasonable way to assess how sentiment around a company has changed is to compare the earnings per share (EPS) with the share price.
Dubai Islamic Bank P.J.S.C was able to grow its EPS at 9.7% per year over three years, sending the share price higher. We note that the 10% yearly (average) share price gain isn't too far from the EPS growth rate. Coincidence? Probably not. That suggests that the market sentiment around the company hasn't changed much over that time. Rather, the share price has approximately tracked EPS growth.
You can see below how EPS has changed over time (discover the exact values by clicking on the image).
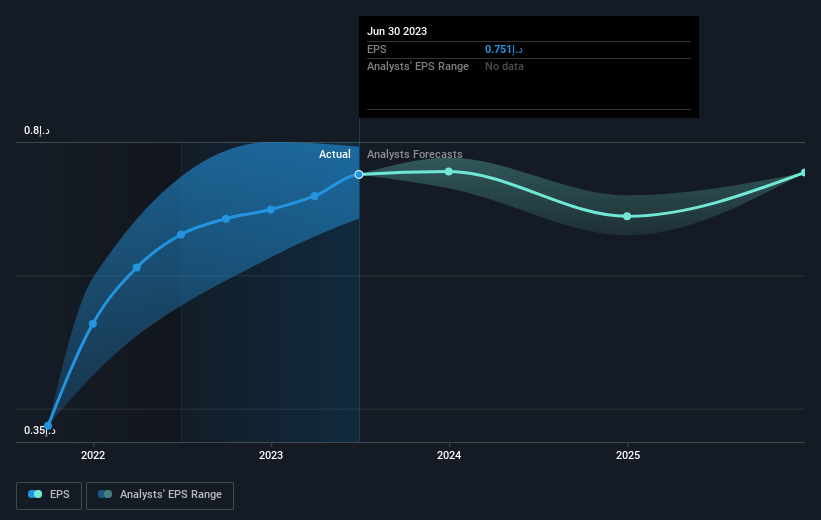
We know that Dubai Islamic Bank P.J.S.C has improved its bottom line lately, but is it going to grow revenue? Check if analysts think Dubai Islamic Bank P.J.S.C will grow revenue in the future.
What About Dividends?
It is important to consider the total shareholder return, as well as the share price return, for any given stock. The TSR incorporates the value of any spin-offs or discounted capital raisings, along with any dividends, based on the assumption that the dividends are reinvested. So for companies that pay a generous dividend, the TSR is often a lot higher than the share price return. As it happens, Dubai Islamic Bank P.J.S.C's TSR for the last 3 years was 54%, which exceeds the share price return mentioned earlier. And there's no prize for guessing that the dividend payments largely explain the divergence!
A Different Perspective
Investors in Dubai Islamic Bank P.J.S.C had a tough year, with a total loss of 3.4% (including dividends), against a market gain of about 4.7%. However, keep in mind that even the best stocks will sometimes underperform the market over a twelve month period. On the bright side, long term shareholders have made money, with a gain of 8% per year over half a decade. It could be that the recent sell-off is an opportunity, so it may be worth checking the fundamental data for signs of a long term growth trend. It's always interesting to track share price performance over the longer term. But to understand Dubai Islamic Bank P.J.S.C better, we need to consider many other factors. For instance, we've identified 2 warning signs for Dubai Islamic Bank P.J.S.C (1 doesn't sit too well with us) that you should be aware of.
For those who like to find winning investments this free list of growing companies with recent insider purchasing, could be just the ticket.
Please note, the market returns quoted in this article reflect the market weighted average returns of stocks that currently trade on Emirian exchanges.
Valuation is complex, but we're helping make it simple.
Find out whether Dubai Islamic Bank P.J.S.C is potentially over or undervalued by checking out our comprehensive analysis, which includes fair value estimates, risks and warnings, dividends, insider transactions and financial health.
View the Free AnalysisHave feedback on this article? Concerned about the content? Get in touch with us directly. Alternatively, email editorial-team (at) simplywallst.com.
This article by Simply Wall St is general in nature. We provide commentary based on historical data and analyst forecasts only using an unbiased methodology and our articles are not intended to be financial advice. It does not constitute a recommendation to buy or sell any stock, and does not take account of your objectives, or your financial situation. We aim to bring you long-term focused analysis driven by fundamental data. Note that our analysis may not factor in the latest price-sensitive company announcements or qualitative material. Simply Wall St has no position in any stocks mentioned.
About DFM:DIB
Dubai Islamic Bank P.J.S.C
Engages in the corporate, retail, and investment banking activities in the United Arab Emirates and internationally.
Established dividend payer with proven track record.
