Stock Analysis
- United Arab Emirates
- /
- Banks
- /
- ADX:SIB
Investors in Sharjah Islamic Bank PJSC (ADX:SIB) have seen splendid returns of 155% over the past three years


The worst result, after buying shares in a company (assuming no leverage), would be if you lose all the money you put in. But if you buy shares in a really great company, you can more than double your money. For example, the Sharjah Islamic Bank PJSC (ADX:SIB) share price has soared 121% in the last three years. How nice for those who held the stock! Also pleasing for shareholders was the 22% gain in the last three months. The company reported its financial results recently; you can catch up on the latest numbers by reading our company report.
So let's assess the underlying fundamentals over the last 3 years and see if they've moved in lock-step with shareholder returns.
View our latest analysis for Sharjah Islamic Bank PJSC
To paraphrase Benjamin Graham: Over the short term the market is a voting machine, but over the long term it's a weighing machine. By comparing earnings per share (EPS) and share price changes over time, we can get a feel for how investor attitudes to a company have morphed over time.
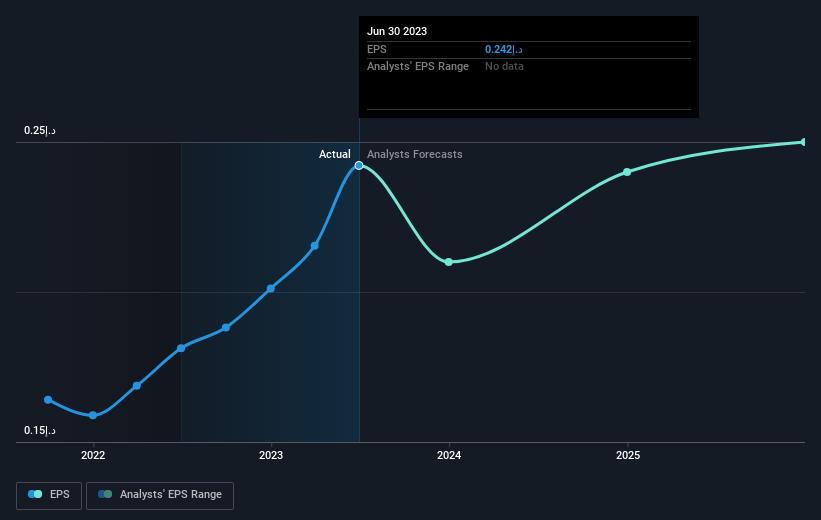
Sharjah Islamic Bank PJSC was able to grow its EPS at 17% per year over three years, sending the share price higher. In comparison, the 30% per year gain in the share price outpaces the EPS growth. So it's fair to assume the market has a higher opinion of the business than it did three years ago. It is quite common to see investors become enamoured with a business, after a few years of solid progress.
The image below shows how EPS has tracked over time (if you click on the image you can see greater detail).
We know that Sharjah Islamic Bank PJSC has improved its bottom line lately, but is it going to grow revenue? If you're interested, you could check this free report showing consensus revenue forecasts.
What About Dividends?
When looking at investment returns, it is important to consider the difference between total shareholder return (TSR) and share price return. Whereas the share price return only reflects the change in the share price, the TSR includes the value of dividends (assuming they were reinvested) and the benefit of any discounted capital raising or spin-off. Arguably, the TSR gives a more comprehensive picture of the return generated by a stock. As it happens, Sharjah Islamic Bank PJSC's TSR for the last 3 years was 155%, which exceeds the share price return mentioned earlier. The dividends paid by the company have thusly boosted the total shareholder return.
A Different Perspective
We're pleased to report that Sharjah Islamic Bank PJSC shareholders have received a total shareholder return of 41% over one year. And that does include the dividend. That's better than the annualised return of 23% over half a decade, implying that the company is doing better recently. In the best case scenario, this may hint at some real business momentum, implying that now could be a great time to delve deeper. While it is well worth considering the different impacts that market conditions can have on the share price, there are other factors that are even more important. Consider for instance, the ever-present spectre of investment risk. We've identified 2 warning signs with Sharjah Islamic Bank PJSC (at least 1 which makes us a bit uncomfortable) , and understanding them should be part of your investment process.
Of course Sharjah Islamic Bank PJSC may not be the best stock to buy. So you may wish to see this free collection of growth stocks.
Please note, the market returns quoted in this article reflect the market weighted average returns of stocks that currently trade on Emirian exchanges.
Valuation is complex, but we're helping make it simple.
Find out whether Sharjah Islamic Bank PJSC is potentially over or undervalued by checking out our comprehensive analysis, which includes fair value estimates, risks and warnings, dividends, insider transactions and financial health.
View the Free AnalysisHave feedback on this article? Concerned about the content? Get in touch with us directly. Alternatively, email editorial-team (at) simplywallst.com.
This article by Simply Wall St is general in nature. We provide commentary based on historical data and analyst forecasts only using an unbiased methodology and our articles are not intended to be financial advice. It does not constitute a recommendation to buy or sell any stock, and does not take account of your objectives, or your financial situation. We aim to bring you long-term focused analysis driven by fundamental data. Note that our analysis may not factor in the latest price-sensitive company announcements or qualitative material. Simply Wall St has no position in any stocks mentioned.
About ADX:SIB
Sharjah Islamic Bank PJSC
Provides banking products and services to individuals and corporates in the United Arab Emirates.
Proven track record with adequate balance sheet.
