
Advertisement
Why Brunello Cucinelli S.p.A.'s (BIT:BC) High P/E Ratio Isn't Necessarily A Bad Thing

Want to participate in a short research study? Help shape the future of investing tools and you could win a $250 gift card!
The goal of this article is to teach you how to use price to earnings ratios (P/E ratios). We'll apply a basic P/E ratio analysis to Brunello Cucinelli S.p.A.'s (BIT:BC), to help you decide if the stock is worth further research. Looking at earnings over the last twelve months, Brunello Cucinelli has a P/E ratio of 39.79. In other words, at today's prices, investors are paying €39.79 for every €1 in prior year profit.
View our latest analysis for Brunello Cucinelli
How Do You Calculate A P/E Ratio?
The formula for P/E is:
Price to Earnings Ratio = Price per Share ÷ Earnings per Share (EPS)
Or for Brunello Cucinelli:
P/E of 39.79 = €29.66 ÷ €0.75 (Based on the trailing twelve months to December 2018.)
Is A High Price-to-Earnings Ratio Good?
A higher P/E ratio means that buyers have to pay a higher price for each €1 the company has earned over the last year. That is not a good or a bad thing per se, but a high P/E does imply buyers are optimistic about the future.
How Growth Rates Impact P/E Ratios
Probably the most important factor in determining what P/E a company trades on is the earnings growth. Earnings growth means that in the future the 'E' will be higher. That means even if the current P/E is high, it will reduce over time if the share price stays flat. So while a stock may look expensive based on past earnings, it could be cheap based on future earnings.
Brunello Cucinelli's earnings per share were pretty steady over the last year. But it has grown its earnings per share by 11% per year over the last five years.
Does Brunello Cucinelli Have A Relatively High Or Low P/E For Its Industry?
One good way to get a quick read on what market participants expect of a company is to look at its P/E ratio. The image below shows that Brunello Cucinelli has a significantly higher P/E than the average (12) P/E for companies in the luxury industry.
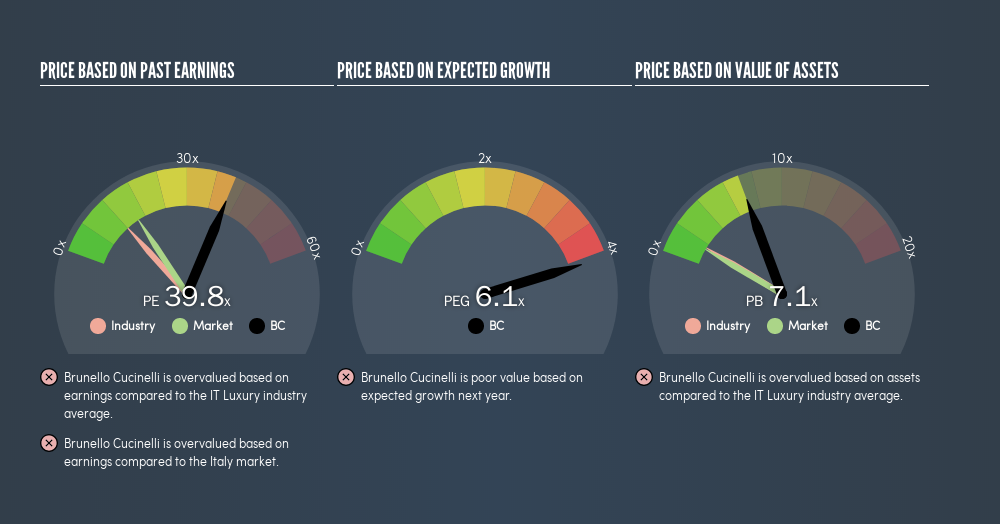
Brunello Cucinelli's P/E tells us that market participants think the company will perform better than its industry peers, going forward.
Remember: P/E Ratios Don't Consider The Balance Sheet
The 'Price' in P/E reflects the market capitalization of the company. In other words, it does not consider any debt or cash that the company may have on the balance sheet. Theoretically, a business can improve its earnings (and produce a lower P/E in the future) by investing in growth. That means taking on debt (or spending its cash).
Such spending might be good or bad, overall, but the key point here is that you need to look at debt to understand the P/E ratio in context.
How Does Brunello Cucinelli's Debt Impact Its P/E Ratio?
Net debt totals just 1.2% of Brunello Cucinelli's market cap. The market might award it a higher P/E ratio if it had net cash, but its unlikely this low level of net borrowing is having a big impact on the P/E multiple.
The Bottom Line On Brunello Cucinelli's P/E Ratio
Brunello Cucinelli trades on a P/E ratio of 39.8, which is above the IT market average of 15.8. With some debt but no EPS growth last year, the market has high expectations of future profits.
When the market is wrong about a stock, it gives savvy investors an opportunity. As value investor Benjamin Graham famously said, 'In the short run, the market is a voting machine but in the long run, it is a weighing machine.' So this free visual report on analyst forecasts could hold the key to an excellent investment decision.
You might be able to find a better buy than Brunello Cucinelli. If you want a selection of possible winners, check out this free list of interesting companies that trade on a P/E below 20 (but have proven they can grow earnings).
We aim to bring you long-term focused research analysis driven by fundamental data. Note that our analysis may not factor in the latest price-sensitive company announcements or qualitative material.
If you spot an error that warrants correction, please contact the editor at editorial-team@simplywallst.com. This article by Simply Wall St is general in nature. It does not constitute a recommendation to buy or sell any stock, and does not take account of your objectives, or your financial situation. Simply Wall St has no position in the stocks mentioned. Thank you for reading.
About BIT:BC
Brunello Cucinelli
Engages in the production and sale of clothing, accessories, and lifestyle products in Italy, Europe, North America, Japan, and China.
Reasonable growth potential with proven track record.
Similar Companies
Market Insights

Advertisement
Community Narratives
Vita Life Sciences Set for a 12.72% Revenue Growth While Tackling Operational Challenges
Fair Value AU$2.42|12.0% undervalued
RO
Community Contributor
Vossloh rides a €500 billion wave to boost growth and earnings in the next decade
Fair Value €78.41|4.0% undervalued
CH
Community Contributor
Intuitive Surgical Will Transform Healthcare with 12% Revenue Growth
Fair Value US$325.55|59.4% overvalued
UN
Community Contributor