
Advertisement
What Can We Make Of Sanwaria Consumer Limited’s (NSE:SANWARIA) High Return On Capital?

Today we'll look at Sanwaria Consumer Limited (NSE:SANWARIA) and reflect on its potential as an investment. Specifically, we'll consider its Return On Capital Employed (ROCE), since that will give us an insight into how efficiently the business can generate profits from the capital it requires.
Firstly, we'll go over how we calculate ROCE. Then we'll compare its ROCE to similar companies. And finally, we'll look at how its current liabilities are impacting its ROCE.
Understanding Return On Capital Employed (ROCE)
ROCE is a measure of a company's yearly pre-tax profit (its return), relative to the capital employed in the business. Generally speaking a higher ROCE is better. In brief, it is a useful tool, but it is not without drawbacks. Author Edwin Whiting says to be careful when comparing the ROCE of different businesses, since 'No two businesses are exactly alike.
How Do You Calculate Return On Capital Employed?
The formula for calculating the return on capital employed is:
Return on Capital Employed = Earnings Before Interest and Tax (EBIT) ÷ (Total Assets - Current Liabilities)
Or for Sanwaria Consumer:
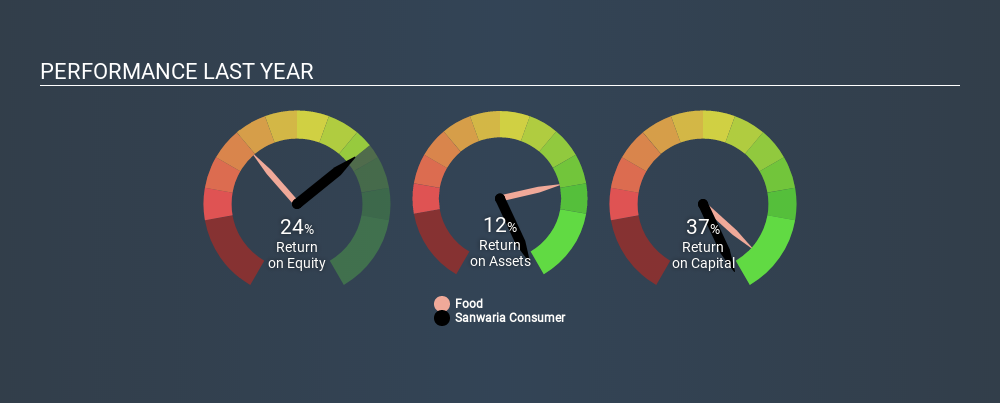
0.37 = ₹2.7b ÷ (₹18b - ₹11b) (Based on the trailing twelve months to March 2019.)
Therefore, Sanwaria Consumer has an ROCE of 37%.
See our latest analysis for Sanwaria Consumer
Does Sanwaria Consumer Have A Good ROCE?
ROCE is commonly used for comparing the performance of similar businesses. Using our data, we find that Sanwaria Consumer's ROCE is meaningfully better than the 11% average in the Food industry. We consider this a positive sign, because it suggests it uses capital more efficiently than similar companies. Putting aside its position relative to its industry for now, in absolute terms, Sanwaria Consumer's ROCE is currently very good.
We can see that, Sanwaria Consumer currently has an ROCE of 37% compared to its ROCE 3 years ago, which was 28%. This makes us wonder if the company is improving. You can click on the image below to see (in greater detail) how Sanwaria Consumer's past growth compares to other companies.
It is important to remember that ROCE shows past performance, and is not necessarily predictive. Companies in cyclical industries can be difficult to understand using ROCE, as returns typically look high during boom times, and low during busts. This is because ROCE only looks at one year, instead of considering returns across a whole cycle. How cyclical is Sanwaria Consumer? You can see for yourself by looking at this free graph of past earnings, revenue and cash flow.
How Sanwaria Consumer's Current Liabilities Impact Its ROCE
Current liabilities are short term bills and invoices that need to be paid in 12 months or less. Due to the way ROCE is calculated, a high level of current liabilities makes a company look as though it has less capital employed, and thus can (sometimes unfairly) boost the ROCE. To counter this, investors can check if a company has high current liabilities relative to total assets.
Sanwaria Consumer has total assets of ₹18b and current liabilities of ₹11b. Therefore its current liabilities are equivalent to approximately 60% of its total assets. While a high level of current liabilities boosts its ROCE, Sanwaria Consumer's returns are still very good.
What We Can Learn From Sanwaria Consumer's ROCE
In my book, this business could be worthy of further research. Sanwaria Consumer shapes up well under this analysis, but it is far from the only business delivering excellent numbers . You might also want to check this free collection of companies delivering excellent earnings growth.
I will like Sanwaria Consumer better if I see some big insider buys. While we wait, check out this free list of growing companies with considerable, recent, insider buying.
If you spot an error that warrants correction, please contact the editor at editorial-team@simplywallst.com. This article by Simply Wall St is general in nature. It does not constitute a recommendation to buy or sell any stock, and does not take account of your objectives, or your financial situation. Simply Wall St has no position in the stocks mentioned.
We aim to bring you long-term focused research analysis driven by fundamental data. Note that our analysis may not factor in the latest price-sensitive company announcements or qualitative material. Thank you for reading.
About NSEI:SANWARIA
Sanwaria Consumer
Sanwaria Consumer Limited is under corporate insolvency resolution process.
Low with imperfect balance sheet.
Similar Companies
Market Insights

Advertisement
Community Narratives
Vita Life Sciences Set for a 12.72% Revenue Growth While Tackling Operational Challenges
Fair Value AU$2.42|9.1% undervalued
RO
Community Contributor
Vossloh rides a €500 billion wave to boost growth and earnings in the next decade
Fair Value €78.41|6.1% undervalued
CH
Community Contributor
Intuitive Surgical Will Transform Healthcare with 12% Revenue Growth
Fair Value US$325.55|56.5% overvalued
UN
Community Contributor