Stock Analysis
We Think Castrol India's (NSE:CASTROLIND) Statutory Profit Might Understate Its Earnings Potential


As a general rule, we think profitable companies are less risky than companies that lose money. That said, the current statutory profit is not always a good guide to a company's underlying profitability. This article will consider whether Castrol India's (NSE:CASTROLIND) statutory profits are a good guide to its underlying earnings.
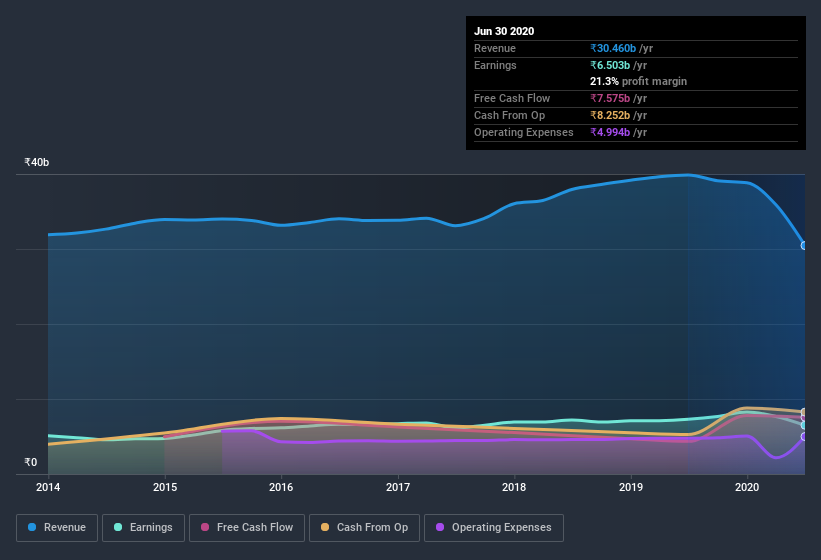
It's good to see that over the last twelve months Castrol India made a profit of ₹6.50b on revenue of ₹30.5b. Even though its revenue is down over the last three years, its profit has actually increased, as you can see, below.
View our latest analysis for Castrol India
Of course, when it comes to statutory profit, the devil is often in the detail, and we can get a better sense for a company by diving deeper into the financial statements. Today, we'll discuss Castrol India's free cashflow relative to its earnings, and consider what that tells us about the company. Note: we always recommend investors check balance sheet strength. Click here to be taken to our balance sheet analysis of Castrol India.
Zooming In On Castrol India's Earnings
In high finance, the key ratio used to measure how well a company converts reported profits into free cash flow (FCF) is the accrual ratio (from cashflow). To get the accrual ratio we first subtract FCF from profit for a period, and then divide that number by the average operating assets for the period. The ratio shows us how much a company's profit exceeds its FCF.
As a result, a negative accrual ratio is a positive for the company, and a positive accrual ratio is a negative. That is not intended to imply we should worry about a positive accrual ratio, but it's worth noting where the accrual ratio is rather high. Notably, there is some academic evidence that suggests that a high accrual ratio is a bad sign for near-term profits, generally speaking.
For the year to June 2020, Castrol India had an accrual ratio of -0.34. That indicates that its free cash flow quite significantly exceeded its statutory profit. Indeed, in the last twelve months it reported free cash flow of ₹7.6b, well over the ₹6.50b it reported in profit. Castrol India's free cash flow improved over the last year, which is generally good to see.
Our Take On Castrol India's Profit Performance
Happily for shareholders, Castrol India produced plenty of free cash flow to back up its statutory profit numbers. Because of this, we think Castrol India's underlying earnings potential is as good as, or possibly even better, than the statutory profit makes it seem! And on top of that, its earnings per share have grown at 6.1% per year over the last three years. The goal of this article has been to assess how well we can rely on the statutory earnings to reflect the company's potential, but there is plenty more to consider. Just as investors must consider earnings, it is also important to take into account the strength of a company's balance sheet. You can see our latest analysis on Castrol India's balance sheet health here.
Today we've zoomed in on a single data point to better understand the nature of Castrol India's profit. But there are plenty of other ways to inform your opinion of a company. Some people consider a high return on equity to be a good sign of a quality business. So you may wish to see this free collection of companies boasting high return on equity, or this list of stocks that insiders are buying.
If you decide to trade Castrol India, use the lowest-cost* platform that is rated #1 Overall by Barron’s, Interactive Brokers. Trade stocks, options, futures, forex, bonds and funds on 135 markets, all from a single integrated account. Promoted
Valuation is complex, but we're helping make it simple.
Find out whether Castrol India is potentially over or undervalued by checking out our comprehensive analysis, which includes fair value estimates, risks and warnings, dividends, insider transactions and financial health.
View the Free AnalysisThis article by Simply Wall St is general in nature. It does not constitute a recommendation to buy or sell any stock, and does not take account of your objectives, or your financial situation. We aim to bring you long-term focused analysis driven by fundamental data. Note that our analysis may not factor in the latest price-sensitive company announcements or qualitative material. Simply Wall St has no position in any stocks mentioned.
*Interactive Brokers Rated Lowest Cost Broker by StockBrokers.com Annual Online Review 2020
Have feedback on this article? Concerned about the content? Get in touch with us directly. Alternatively, email editorial-team@simplywallst.com.
About NSEI:CASTROLIND
Castrol India
Manufactures and markets automotive and industrial lubricants in India and internationally.
Outstanding track record with excellent balance sheet and pays a dividend.
