
Advertisement
Should You Be Worried About Suryalakshmi Cotton Mills' (NSE:SURYALAXMI) Returns On Capital?
What underlying fundamental trends can indicate that a company might be in decline? A business that's potentially in decline often shows two trends, a return on capital employed (ROCE) that's declining, and a base of capital employed that's also declining. Ultimately this means that the company is earning less per dollar invested and on top of that, it's shrinking its base of capital employed. So after we looked into Suryalakshmi Cotton Mills (NSE:SURYALAXMI), the trends above didn't look too great.
Understanding Return On Capital Employed (ROCE)
If you haven't worked with ROCE before, it measures the 'return' (pre-tax profit) a company generates from capital employed in its business. The formula for this calculation on Suryalakshmi Cotton Mills is:
Return on Capital Employed = Earnings Before Interest and Tax (EBIT) ÷ (Total Assets - Current Liabilities)
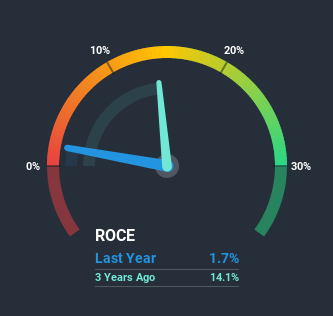
0.017 = ₹66m ÷ (₹7.3b - ₹3.4b) (Based on the trailing twelve months to March 2020).
Therefore, Suryalakshmi Cotton Mills has an ROCE of 1.7%. Ultimately, that's a low return and it under-performs the Luxury industry average of 10%.
Check out our latest analysis for Suryalakshmi Cotton Mills
While the past is not representative of the future, it can be helpful to know how a company has performed historically, which is why we have this chart above. If you're interested in investigating Suryalakshmi Cotton Mills' past further, check out this free graph of past earnings, revenue and cash flow.
What Does the ROCE Trend For Suryalakshmi Cotton Mills Tell Us?
In terms of Suryalakshmi Cotton Mills' historical ROCE trend, it isn't fantastic. Unfortunately, returns have declined substantially over the last five years to the 1.7% we see today. In addition to that, Suryalakshmi Cotton Mills is now employing 21% less capital than it was five years ago. When you see both ROCE and capital employed diminishing, it can often be a sign of a mature and shrinking business that might be in structural decline. Typically businesses that exhibit these characteristics aren't the ones that tend to multiply over the long term, because statistically speaking, they've already gone through the growth phase of their life cycle.
On a side note, Suryalakshmi Cotton Mills' current liabilities have increased over the last five years to 47% of total assets, effectively distorting the ROCE to some degree. If current liabilities hadn't increased as much as they did, the ROCE could actually be even lower. What this means is that in reality, a rather large portion of the business is being funded by the likes of the company's suppliers or short-term creditors, which can bring some risks of its own.The Key Takeaway
In short, lower returns and decreasing amounts capital employed in the business doesn't fill us with confidence. This could explain why the stock has sunk a total of 87% in the last five years. That being the case, unless the underlying trends revert to a more positive trajectory, we'd consider looking elsewhere.
If you'd like to know more about Suryalakshmi Cotton Mills, we've spotted 4 warning signs, and 3 of them can't be ignored.
While Suryalakshmi Cotton Mills isn't earning the highest return, check out this free list of companies that are earning high returns on equity with solid balance sheets.
If you decide to trade Suryalakshmi Cotton Mills, use the lowest-cost* platform that is rated #1 Overall by Barron’s, Interactive Brokers. Trade stocks, options, futures, forex, bonds and funds on 135 markets, all from a single integrated account. Promoted
New: Manage All Your Stock Portfolios in One Place
We've created the ultimate portfolio companion for stock investors, and it's free.
• Connect an unlimited number of Portfolios and see your total in one currency
• Be alerted to new Warning Signs or Risks via email or mobile
• Track the Fair Value of your stocks
This article by Simply Wall St is general in nature. It does not constitute a recommendation to buy or sell any stock, and does not take account of your objectives, or your financial situation. We aim to bring you long-term focused analysis driven by fundamental data. Note that our analysis may not factor in the latest price-sensitive company announcements or qualitative material. Simply Wall St has no position in any stocks mentioned.
*Interactive Brokers Rated Lowest Cost Broker by StockBrokers.com Annual Online Review 2020
Have feedback on this article? Concerned about the content? Get in touch with us directly. Alternatively, email editorial-team@simplywallst.com.
About NSEI:SURYALAXMI
Suryalakshmi Cotton Mills
Engages in the manufacture and sale of cotton and blended yarns, denim fabrics, and garments in India, Bangladesh, Ethiopia, Guatemala, Kenya, Mauritius, Madagascar, South Korea, and internationally.
Solid track record with mediocre balance sheet.
Market Insights

Advertisement
Community Narratives
The company that turned a verb into a global necessity and basically runs the modern internet, digital ads, smartphones, maps, and AI.
Fair Value US$300.00|5.2% undervalued
OS
Community Contributor
Flowers Foods Pays A Fair Price For Health
Fair Value US$16.12|24.9% undervalued
NV
Community Contributor
TMX Group will thrive with 33.3% profit margin and enduring market moat
Fair Value CA$49.90|3.3% overvalued
LI
Community Contributor
The "Molecular Pencil": Why Beam's Technology is Built to Win
Fair Value US$65.01|64.5% undervalued
DA
Community Contributor