
Advertisement
Should You Be Tempted To Sell Pilkington Deutschland AG (HMSE:FDD) Because Of Its P/E Ratio?

This article is for investors who would like to improve their understanding of price to earnings ratios (P/E ratios). We'll show how you can use Pilkington Deutschland AG's (HMSE:FDD) P/E ratio to inform your assessment of the investment opportunity. Looking at earnings over the last twelve months, Pilkington Deutschland has a P/E ratio of 52.95. That is equivalent to an earnings yield of about 1.9%.
View our latest analysis for Pilkington Deutschland
How Do I Calculate A Price To Earnings Ratio?
The formula for P/E is:
Price to Earnings Ratio = Price per Share ÷ Earnings per Share (EPS)
Or for Pilkington Deutschland:
P/E of 52.95 = EUR416.00 ÷ EUR7.86 (Based on the year to March 2019.)
Is A High P/E Ratio Good?
A higher P/E ratio means that investors are paying a higher price for each EUR1 of company earnings. That isn't a good or a bad thing on its own, but a high P/E means that buyers have a higher opinion of the business's prospects, relative to stocks with a lower P/E.
Does Pilkington Deutschland Have A Relatively High Or Low P/E For Its Industry?
One good way to get a quick read on what market participants expect of a company is to look at its P/E ratio. The image below shows that Pilkington Deutschland has a higher P/E than the average (20.9) P/E for companies in the building industry.
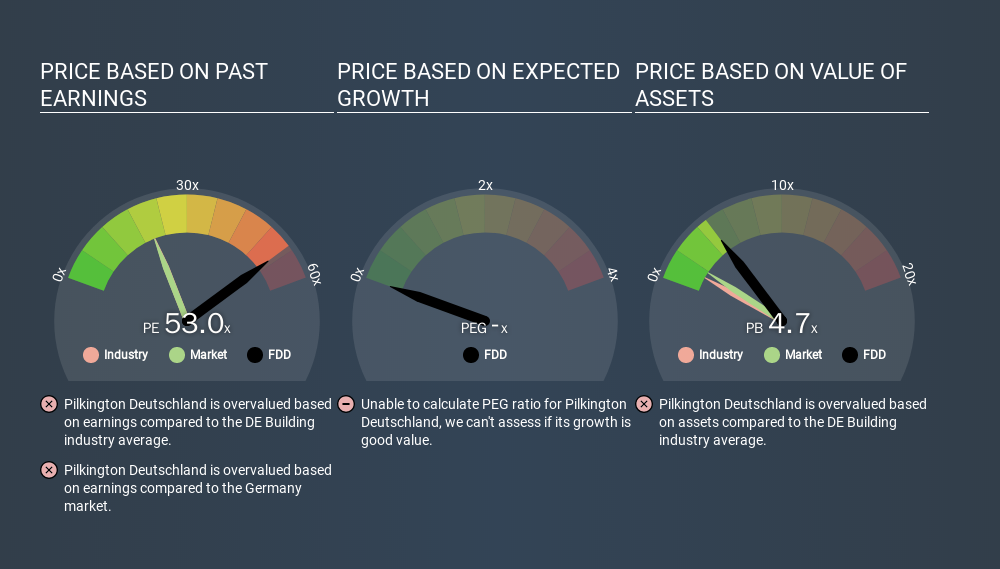
Pilkington Deutschland's P/E tells us that market participants think the company will perform better than its industry peers, going forward. Clearly the market expects growth, but it isn't guaranteed. So further research is always essential. I often monitor director buying and selling.
How Growth Rates Impact P/E Ratios
P/E ratios primarily reflect market expectations around earnings growth rates. That's because companies that grow earnings per share quickly will rapidly increase the 'E' in the equation. That means even if the current P/E is high, it will reduce over time if the share price stays flat. So while a stock may look expensive based on past earnings, it could be cheap based on future earnings.
Pilkington Deutschland shrunk earnings per share by 37% over the last year. But EPS is up 33% over the last 5 years.
Remember: P/E Ratios Don't Consider The Balance Sheet
One drawback of using a P/E ratio is that it considers market capitalization, but not the balance sheet. In other words, it does not consider any debt or cash that the company may have on the balance sheet. Hypothetically, a company could reduce its future P/E ratio by spending its cash (or taking on debt) to achieve higher earnings.
Spending on growth might be good or bad a few years later, but the point is that the P/E ratio does not account for the option (or lack thereof).
So What Does Pilkington Deutschland's Balance Sheet Tell Us?
Since Pilkington Deutschland holds net cash of €139k, it can spend on growth, justifying a higher P/E ratio than otherwise.
The Bottom Line On Pilkington Deutschland's P/E Ratio
Pilkington Deutschland's P/E is 53.0 which is above average (20.8) in its market. The recent drop in earnings per share would make some investors cautious, but the relatively strong balance sheet will allow the company time to invest in growth. Clearly, the high P/E indicates shareholders think it will!
Investors have an opportunity when market expectations about a stock are wrong. If the reality for a company is better than it expects, you can make money by buying and holding for the long term. We don't have analyst forecasts, but you might want to assess this data-rich visualization of earnings, revenue and cash flow.
You might be able to find a better buy than Pilkington Deutschland. If you want a selection of possible winners, check out this free list of interesting companies that trade on a P/E below 20 (but have proven they can grow earnings).
If you spot an error that warrants correction, please contact the editor at editorial-team@simplywallst.com. This article by Simply Wall St is general in nature. It does not constitute a recommendation to buy or sell any stock, and does not take account of your objectives, or your financial situation. Simply Wall St has no position in the stocks mentioned.
We aim to bring you long-term focused research analysis driven by fundamental data. Note that our analysis may not factor in the latest price-sensitive company announcements or qualitative material. Thank you for reading.
About HMSE:FDD
Pilkington Deutschland
Engages in the manufacture and sale of glass and glazing systems worldwide.
Flawless balance sheet and slightly overvalued.
Market Insights

Advertisement
Community Narratives
Vita Life Sciences Set for a 12.72% Revenue Growth While Tackling Operational Challenges
Fair Value AU$2.42|12.0% undervalued
RO
Community Contributor
Vossloh rides a €500 billion wave to boost growth and earnings in the next decade
Fair Value €78.41|5.2% undervalued
CH
Community Contributor
Intuitive Surgical Will Transform Healthcare with 12% Revenue Growth
Fair Value US$325.55|57.3% overvalued
UN
Community Contributor