
Advertisement
- United Kingdom
- /
- Electric Utilities
- /
- AIM:OPG
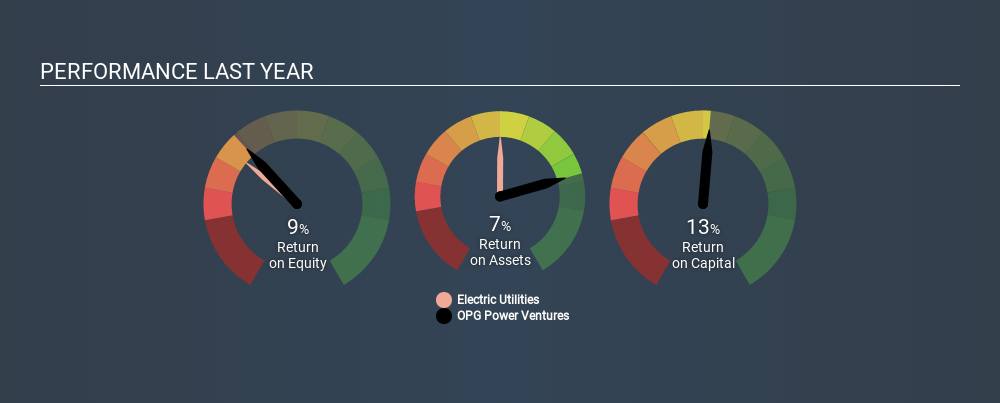
OPG Power Ventures Plc (LON:OPG) Is Employing Capital Very Effectively

Today we are going to look at OPG Power Ventures Plc (LON:OPG) to see whether it might be an attractive investment prospect. Specifically, we'll consider its Return On Capital Employed (ROCE), since that will give us an insight into how efficiently the business can generate profits from the capital it requires.
First up, we'll look at what ROCE is and how we calculate it. Second, we'll look at its ROCE compared to similar companies. Finally, we'll look at how its current liabilities affect its ROCE.
Understanding Return On Capital Employed (ROCE)
ROCE measures the 'return' (pre-tax profit) a company generates from capital employed in its business. In general, businesses with a higher ROCE are usually better quality. In brief, it is a useful tool, but it is not without drawbacks. Author Edwin Whiting says to be careful when comparing the ROCE of different businesses, since 'No two businesses are exactly alike.
So, How Do We Calculate ROCE?
Analysts use this formula to calculate return on capital employed:
Return on Capital Employed = Earnings Before Interest and Tax (EBIT) ÷ (Total Assets - Current Liabilities)
Or for OPG Power Ventures:
0.13 = UK£29m ÷ (UK£341m - UK£109m) (Based on the trailing twelve months to September 2019.)
So, OPG Power Ventures has an ROCE of 13%.
Check out our latest analysis for OPG Power Ventures
Is OPG Power Ventures's ROCE Good?
When making comparisons between similar businesses, investors may find ROCE useful. Using our data, we find that OPG Power Ventures's ROCE is meaningfully better than the 6.9% average in the Electric Utilities industry. We would consider this a positive, as it suggests it is using capital more effectively than other similar companies. Independently of how OPG Power Ventures compares to its industry, its ROCE in absolute terms appears decent, and the company may be worthy of closer investigation.
You can see in the image below how OPG Power Ventures's ROCE compares to its industry. Click to see more on past growth.
It is important to remember that ROCE shows past performance, and is not necessarily predictive. ROCE can be misleading for companies in cyclical industries, with returns looking impressive during the boom times, but very weak during the busts. This is because ROCE only looks at one year, instead of considering returns across a whole cycle. Since the future is so important for investors, you should check out our free report on analyst forecasts for OPG Power Ventures.
What Are Current Liabilities, And How Do They Affect OPG Power Ventures's ROCE?
Current liabilities are short term bills and invoices that need to be paid in 12 months or less. The ROCE equation subtracts current liabilities from capital employed, so a company with a lot of current liabilities appears to have less capital employed, and a higher ROCE than otherwise. To counter this, investors can check if a company has high current liabilities relative to total assets.
OPG Power Ventures has current liabilities of UK£109m and total assets of UK£341m. As a result, its current liabilities are equal to approximately 32% of its total assets. OPG Power Ventures has a middling amount of current liabilities, increasing its ROCE somewhat.
The Bottom Line On OPG Power Ventures's ROCE
While its ROCE looks good, it's worth remembering that the current liabilities are making the business look better. There might be better investments than OPG Power Ventures out there, but you will have to work hard to find them . These promising businesses with rapidly growing earnings might be right up your alley.
If you are like me, then you will not want to miss this free list of growing companies that insiders are buying.
If you spot an error that warrants correction, please contact the editor at editorial-team@simplywallst.com. This article by Simply Wall St is general in nature. It does not constitute a recommendation to buy or sell any stock, and does not take account of your objectives, or your financial situation. Simply Wall St has no position in the stocks mentioned.
We aim to bring you long-term focused research analysis driven by fundamental data. Note that our analysis may not factor in the latest price-sensitive company announcements or qualitative material. Thank you for reading.
About AIM:OPG
OPG Power Ventures
Develops, owns, operates, and maintains private sector power projects in India.
Flawless balance sheet and good value.
Market Insights

Advertisement
Community Narratives
Vita Life Sciences Set for a 12.72% Revenue Growth While Tackling Operational Challenges
Fair Value AU$2.42|9.5% undervalued
RO
Community Contributor
Vossloh rides a €500 billion wave to boost growth and earnings in the next decade
Fair Value €78.41|7.2% undervalued
CH
Community Contributor
Intuitive Surgical Will Transform Healthcare with 12% Revenue Growth
Fair Value US$325.55|56.5% overvalued
UN
Community Contributor