
Advertisement
Is Intertape Polymer Group Inc.'s (TSE:ITP) P/E Ratio Really That Good?
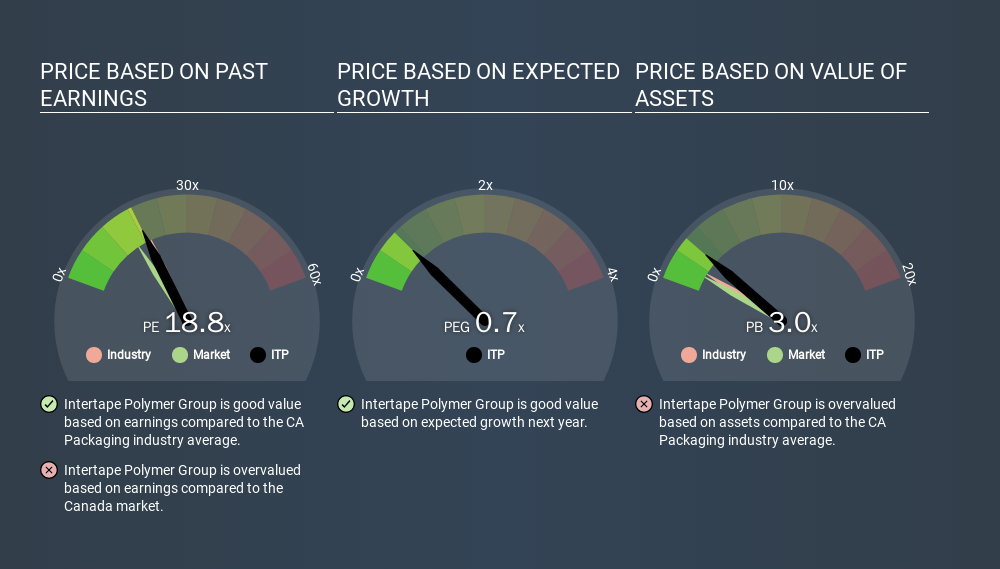
This article is for investors who would like to improve their understanding of price to earnings ratios (P/E ratios). To keep it practical, we'll show how Intertape Polymer Group Inc.'s (TSE:ITP) P/E ratio could help you assess the value on offer. Based on the last twelve months, Intertape Polymer Group's P/E ratio is 18.78. That means that at current prices, buyers pay CA$18.78 for every CA$1 in trailing yearly profits.
See our latest analysis for Intertape Polymer Group
How Do I Calculate A Price To Earnings Ratio?
The formula for P/E is:
Price to Earnings Ratio = Price per Share (in the reporting currency) ÷ Earnings per Share (EPS)
Or for Intertape Polymer Group:
P/E of 18.78 = USD12.85 (Note: this is the share price in the reporting currency, namely, USD ) ÷ USD0.68 (Based on the year to September 2019.)
Is A High Price-to-Earnings Ratio Good?
The higher the P/E ratio, the higher the price tag of a business, relative to its trailing earnings. That isn't a good or a bad thing on its own, but a high P/E means that buyers have a higher opinion of the business's prospects, relative to stocks with a lower P/E.
Does Intertape Polymer Group Have A Relatively High Or Low P/E For Its Industry?
We can get an indication of market expectations by looking at the P/E ratio. You can see in the image below that the average P/E (19.8) for companies in the packaging industry is roughly the same as Intertape Polymer Group's P/E.
Its P/E ratio suggests that Intertape Polymer Group shareholders think that in the future it will perform about the same as other companies in its industry classification. So if Intertape Polymer Group actually outperforms its peers going forward, that should be a positive for the share price. Checking factors such as director buying and selling. could help you form your own view on if that will happen.
How Growth Rates Impact P/E Ratios
When earnings fall, the 'E' decreases, over time. That means even if the current P/E is low, it will increase over time if the share price stays flat. A higher P/E should indicate the stock is expensive relative to others -- and that may encourage shareholders to sell.
Intertape Polymer Group shrunk earnings per share by 30% over the last year. And EPS is down 13% a year, over the last 5 years. This growth rate might warrant a below average P/E ratio.
Don't Forget: The P/E Does Not Account For Debt or Bank Deposits
It's important to note that the P/E ratio considers the market capitalization, not the enterprise value. In other words, it does not consider any debt or cash that the company may have on the balance sheet. Theoretically, a business can improve its earnings (and produce a lower P/E in the future) by investing in growth. That means taking on debt (or spending its cash).
Such expenditure might be good or bad, in the long term, but the point here is that the balance sheet is not reflected by this ratio.
How Does Intertape Polymer Group's Debt Impact Its P/E Ratio?
Intertape Polymer Group has net debt worth 66% of its market capitalization. This is enough debt that you'd have to make some adjustments before using the P/E ratio to compare it to a company with net cash.
The Verdict On Intertape Polymer Group's P/E Ratio
Intertape Polymer Group's P/E is 18.8 which is above average (15.8) in its market. With relatively high debt, and no earnings per share growth over twelve months, it's safe to say the market believes the company will improve its earnings growth in the future.
Investors have an opportunity when market expectations about a stock are wrong. People often underestimate remarkable growth -- so investors can make money when fast growth is not fully appreciated. So this free visualization of the analyst consensus on future earnings could help you make the right decision about whether to buy, sell, or hold.
Of course, you might find a fantastic investment by looking at a few good candidates. So take a peek at this free list of companies with modest (or no) debt, trading on a P/E below 20.
If you spot an error that warrants correction, please contact the editor at editorial-team@simplywallst.com. This article by Simply Wall St is general in nature. It does not constitute a recommendation to buy or sell any stock, and does not take account of your objectives, or your financial situation. Simply Wall St has no position in the stocks mentioned.
We aim to bring you long-term focused research analysis driven by fundamental data. Note that our analysis may not factor in the latest price-sensitive company announcements or qualitative material. Thank you for reading.
About TSX:ITP
Intertape Polymer Group
Intertape Polymer Group Inc. provides packaging and protective solutions for the industrial markets in North America, Europe, and internationally.
Undervalued with moderate growth potential.
Similar Companies
Market Insights

Advertisement
Community Narratives
Vita Life Sciences Set for a 12.72% Revenue Growth While Tackling Operational Challenges
Fair Value AU$2.42|12.0% undervalued
RO
Community Contributor
Vossloh rides a €500 billion wave to boost growth and earnings in the next decade
Fair Value €78.41|5.2% undervalued
CH
Community Contributor
Intuitive Surgical Will Transform Healthcare with 12% Revenue Growth
Fair Value US$325.55|57.3% overvalued
UN
Community Contributor