
Advertisement
Is GW Pharmaceuticals (NASDAQ:GWPH) Using Debt In A Risky Way?
Howard Marks put it nicely when he said that, rather than worrying about share price volatility, 'The possibility of permanent loss is the risk I worry about... and every practical investor I know worries about.' When we think about how risky a company is, we always like to look at its use of debt, since debt overload can lead to ruin. We note that GW Pharmaceuticals plc (NASDAQ:GWPH) does have debt on its balance sheet. But the more important question is: how much risk is that debt creating?
Why Does Debt Bring Risk?
Debt and other liabilities become risky for a business when it cannot easily fulfill those obligations, either with free cash flow or by raising capital at an attractive price. Part and parcel of capitalism is the process of 'creative destruction' where failed businesses are mercilessly liquidated by their bankers. However, a more common (but still painful) scenario is that it has to raise new equity capital at a low price, thus permanently diluting shareholders. Of course, the upside of debt is that it often represents cheap capital, especially when it replaces dilution in a company with the ability to reinvest at high rates of return. When we examine debt levels, we first consider both cash and debt levels, together.
View our latest analysis for GW Pharmaceuticals
What Is GW Pharmaceuticals's Debt?
The image below, which you can click on for greater detail, shows that GW Pharmaceuticals had debt of US$9.69m at the end of June 2019, a reduction from US$17.0m over a year. But it also has US$583.7m in cash to offset that, meaning it has US$574.0m net cash.
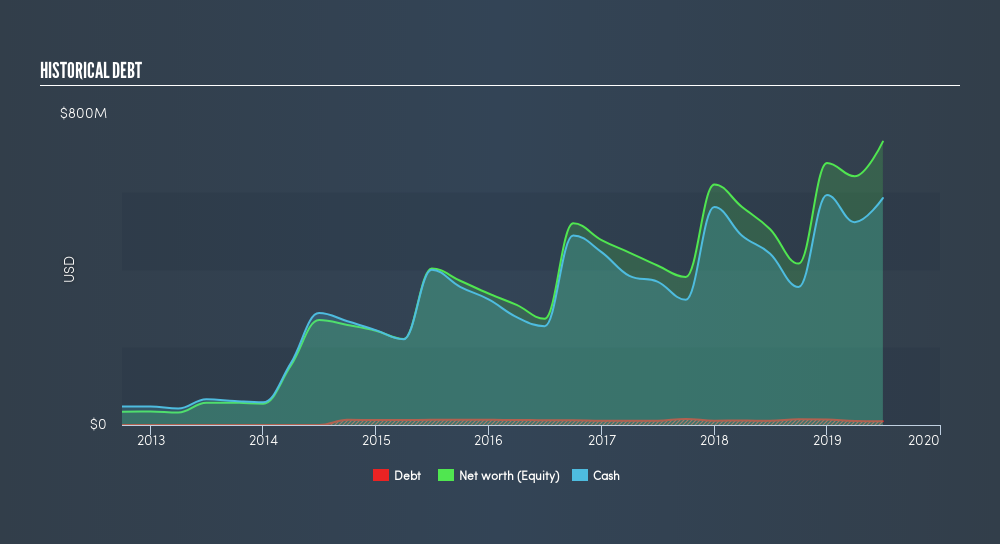
A Look At GW Pharmaceuticals's Liabilities
According to the last reported balance sheet, GW Pharmaceuticals had liabilities of US$83.9m due within 12 months, and liabilities of US$29.9m due beyond 12 months. Offsetting this, it had US$583.7m in cash and US$32.1m in receivables that were due within 12 months. So it actually has US$501.9m more liquid assets than total liabilities.
This surplus suggests that GW Pharmaceuticals has a conservative balance sheet, and could probably eliminate its debt without much difficulty. Succinctly put, GW Pharmaceuticals boasts net cash, so it's fair to say it does not have a heavy debt load! The balance sheet is clearly the area to focus on when you are analysing debt. But ultimately the future profitability of the business will decide if GW Pharmaceuticals can strengthen its balance sheet over time. So if you want to see what the professionals think, you might find this free report on analyst profit forecasts to be interesting.
Over 12 months, GW Pharmaceuticals reported revenue of US$132m, which is a gain of 674%. When it comes to revenue growth, that's like nailing the game winning 3-pointer!
So How Risky Is GW Pharmaceuticals?
By their very nature companies that are losing money are more risky than those with a long history of profitability. And the fact is that over the last twelve months GW Pharmaceuticals lost money at the earnings before interest and tax (EBIT) line. And over the same period it saw negative free cash outflow of US$372m and booked a US$104m accounting loss. But at least it has US$584m on the balance sheet to spend on growth, near-term. Importantly, GW Pharmaceuticals's revenue growth is hot to trot. High growth pre-profit companies may well be risky, but they can also offer great rewards. For riskier companies like GW Pharmaceuticals I always like to keep an eye on the long term profit and revenue trends. Fortunately, you can click to see our interactive graph of its profit, revenue, and operating cashflow.
At the end of the day, it's often better to focus on companies that are free from net debt. You can access our special list of such companies (all with a track record of profit growth). It's free.
We aim to bring you long-term focused research analysis driven by fundamental data. Note that our analysis may not factor in the latest price-sensitive company announcements or qualitative material.
If you spot an error that warrants correction, please contact the editor at editorial-team@simplywallst.com. This article by Simply Wall St is general in nature. It does not constitute a recommendation to buy or sell any stock, and does not take account of your objectives, or your financial situation. Simply Wall St has no position in the stocks mentioned. Thank you for reading.

 Mitchell Lawler
Market Insights
What happens to energy stocks as the fix gets built?

Conflict around the Strait of Hormuz has led investors to oil and tankers. The trouble is, the antidote to the chokepoints is already being built, and it may not reward the same energy stocks.
88
Market Insights


Advertisement
Weekly Picks
CE


Ceazar on Buffalo Potash ·
Under the radar: This $78M stock controls a $1.5B project and it’ll start producing in a few months
Fair Value:CA$1.0625.5% undervalued
1 followerusers have followed this narrative
0 commentsusers have commented on this narrative
0 likesusers have liked this narrative
TO


Tokyo on Novo Nordisk ·
EU#2 - From Humble Beginnings to Global Powerhouse
Fair Value:DKK 851.0469.4% undervalued
75 followersusers have followed this narrative
11 commentsusers have commented on this narrative
25 likesusers have liked this narrative
HA


HarishPK on Zoetis ·
Decision Making Under Ambiguity – A Case Study on Expectations Investing
Fair Value:US$91.321.9% undervalued
3 followersusers have followed this narrative
1 commentusers have commented on this narrative
2 likesusers have liked this narrative
RE


RedCandleRx on AppLovin ·
Why the Market Still Misprices AppLovin as Just a Gaming Network
Fair Value:US$50734.9% undervalued
1 followerusers have followed this narrative
0 commentsusers have commented on this narrative
0 likesusers have liked this narrative
Recently Updated Narratives
HE

Heavysvene on Akamai Technologies ·
Akamai Technologies will see a 16.49% revenue increase driving growth
Fair Value:€139.2227.1% undervalued
1 followerusers have followed this narrative
0 commentsusers have commented on this narrative
0 likesusers have liked this narrative
PE

Pedro7 on Reklaim ·
Consent-based data just turned profitable. Q3 decides if it lasts.
Fair Value:CA$0.320% overvalued
1 followerusers have followed this narrative
0 commentsusers have commented on this narrative
0 likesusers have liked this narrative
RO


RockeTeller on Polymetals Resources ·
Polymetals Resources, 338 g/t Silver A$28M Restart at A$414M NPV, The Numbers That Matter
Fair Value:AU$1.9756.9% undervalued
5 followersusers have followed this narrative
0 commentsusers have commented on this narrative
1 likeusers have liked this narrative
Popular Narratives
AN


AnalystConsensusTarget on NVIDIA ·
NVDA: Expanding AI Demand Will Drive Major Data Center Investments Through 2026
Fair Value:US$302.8324.9% undervalued
1493 followersusers have followed this narrative
8 commentsusers have commented on this narrative
35 likesusers have liked this narrative
AN

AnalystConsensusTarget on Alphabet ·
GOOGL: AI Platform Expansion And Cloud Demand Will Support Durable Performance Amid Competitive Pressures
Fair Value:US$427.8917.0% undervalued
1650 followersusers have followed this narrative
0 commentsusers have commented on this narrative
19 likesusers have liked this narrative
AN

AnalystConsensusTarget on Amazon.com ·
AMZN: Acceleration In Cloud And AI Will Drive Margin Expansion Ahead
Fair Value:US$32721.0% undervalued
1668 followersusers have followed this narrative
1 commentusers have commented on this narrative
16 likesusers have liked this narrative
Trending Discussion


JO

john_mwm1h on Hemab Therapeutics Holdings ·
One thing I find disappointing about this model is how rare disease communities can become attractive targets because development pathways may move faster with smaller patient populations. The marketing they run creates the impression that patients are constantly in danger or have no meaningful options without the newest treatment, which does not reflect every patient’s experience.I would bet many do not even realize that gene therapy for Glanzmann Thrombasthenia is getting closer to clinical trials, yet that research continues to struggle for funding while commercial drug developers can raise hundreds of millions of dollars.
0
|0