Stock Analysis


While it may not be enough for some shareholders, we think it is good to see the ICRA Limited (NSE:ICRA) share price up 13% in a single quarter. But over the last half decade, the stock has not performed well. In fact, the share price is down 28%, which falls well short of the return you could get by buying an index fund.
View our latest analysis for ICRA
There is no denying that markets are sometimes efficient, but prices do not always reflect underlying business performance. One way to examine how market sentiment has changed over time is to look at the interaction between a company's share price and its earnings per share (EPS).
During the unfortunate half decade during which the share price slipped, ICRA actually saw its earnings per share (EPS) improve by 8.4% per year. Given the share price reaction, one might suspect that EPS is not a good guide to the business performance during the period (perhaps due to a one-off loss or gain). Alternatively, growth expectations may have been unreasonable in the past.
Due to the lack of correlation between the EPS growth and the falling share price, it's worth taking a look at other metrics to try to understand the share price movement.
The modest 1.0% dividend yield is unlikely to be guiding the market view of the stock. The revenue fall of 0.8% per year for five years is neither good nor terrible. But it's quite possible the market had expected better; a closer look at the revenue trends might explain the pessimism.
The graphic below depicts how earnings and revenue have changed over time (unveil the exact values by clicking on the image).
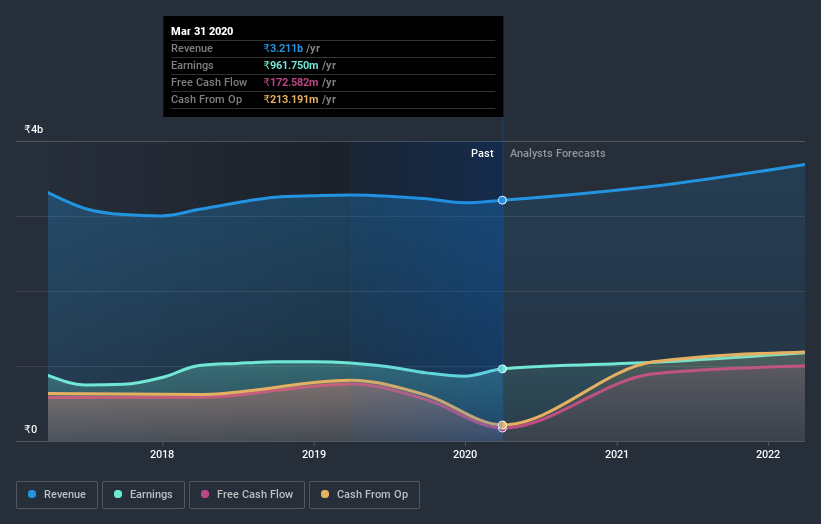
You can see how its balance sheet has strengthened (or weakened) over time in this free interactive graphic.
What About Dividends?
When looking at investment returns, it is important to consider the difference between total shareholder return (TSR) and share price return. The TSR is a return calculation that accounts for the value of cash dividends (assuming that any dividend received was reinvested) and the calculated value of any discounted capital raisings and spin-offs. Arguably, the TSR gives a more comprehensive picture of the return generated by a stock. We note that for ICRA the TSR over the last 5 years was -26%, which is better than the share price return mentioned above. And there's no prize for guessing that the dividend payments largely explain the divergence!
A Different Perspective
ICRA shareholders are up 4.6% for the year (even including dividends). Unfortunately this falls short of the market return. On the bright side, that's still a gain, and it is certainly better than the yearly loss of about 4.8% endured over half a decade. So this might be a sign the business has turned its fortunes around. It's always interesting to track share price performance over the longer term. But to understand ICRA better, we need to consider many other factors. Consider risks, for instance. Every company has them, and we've spotted 1 warning sign for ICRA you should know about.
But note: ICRA may not be the best stock to buy. So take a peek at this free list of interesting companies with past earnings growth (and further growth forecast).
Please note, the market returns quoted in this article reflect the market weighted average returns of stocks that currently trade on IN exchanges.
When trading ICRA or any other investment, use the platform considered by many to be the Professional's Gateway to the Worlds Market, Interactive Brokers. You get the lowest-cost* trading on stocks, options, futures, forex, bonds and funds worldwide from a single integrated account. Promoted
Valuation is complex, but we're helping make it simple.
Find out whether ICRA is potentially over or undervalued by checking out our comprehensive analysis, which includes fair value estimates, risks and warnings, dividends, insider transactions and financial health.
View the Free AnalysisThis article by Simply Wall St is general in nature. It does not constitute a recommendation to buy or sell any stock, and does not take account of your objectives, or your financial situation. We aim to bring you long-term focused analysis driven by fundamental data. Note that our analysis may not factor in the latest price-sensitive company announcements or qualitative material. Simply Wall St has no position in any stocks mentioned.
*Interactive Brokers Rated Lowest Cost Broker by StockBrokers.com Annual Online Review 2020
Have feedback on this article? Concerned about the content? Get in touch with us directly. Alternatively, email editorial-team@simplywallst.com.
About NSEI:ICRA
ICRA
Operates as an independent and professional investment information, and credit rating agency in India and internationally.
Excellent balance sheet established dividend payer.
