
Advertisement
- France
- /
- Transportation
- /
- ENXTPA:STF
How Much Did STEF's(EPA:STF) Shareholders Earn From Share Price Movements Over The Last Three Years?

In order to justify the effort of selecting individual stocks, it's worth striving to beat the returns from a market index fund. But its virtually certain that sometimes you will buy stocks that fall short of the market average returns. We regret to report that long term STEF SA (EPA:STF) shareholders have had that experience, with the share price dropping 28% in three years, versus a market return of about 13%.
See our latest analysis for STEF
To paraphrase Benjamin Graham: Over the short term the market is a voting machine, but over the long term it's a weighing machine. One flawed but reasonable way to assess how sentiment around a company has changed is to compare the earnings per share (EPS) with the share price.
During the unfortunate three years of share price decline, STEF actually saw its earnings per share (EPS) improve by 4.6% per year. Given the share price reaction, one might suspect that EPS is not a good guide to the business performance during the period (perhaps due to a one-off loss or gain). Alternatively, growth expectations may have been unreasonable in the past.
It's pretty reasonable to suspect the market was previously to bullish on the stock, and has since moderated expectations. Looking to other metrics might better explain the share price change.
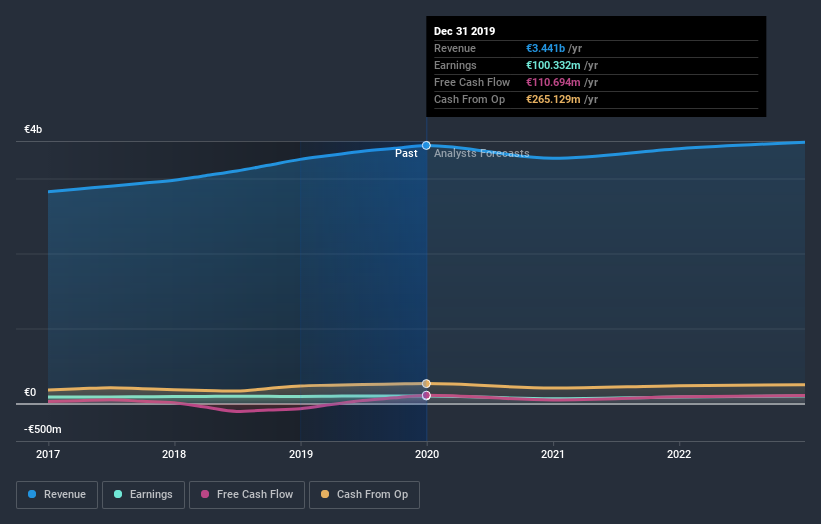
We note that, in three years, revenue has actually grown at a 7.1% annual rate, so that doesn't seem to be a reason to sell shares. It's probably worth investigating STEF further; while we may be missing something on this analysis, there might also be an opportunity.
You can see below how earnings and revenue have changed over time (discover the exact values by clicking on the image).
Balance sheet strength is crucial. It might be well worthwhile taking a look at our free report on how its financial position has changed over time.
What about the Total Shareholder Return (TSR)?
Investors should note that there's a difference between STEF's total shareholder return (TSR) and its share price change, which we've covered above. Arguably the TSR is a more complete return calculation because it accounts for the value of dividends (as if they were reinvested), along with the hypothetical value of any discounted capital that have been offered to shareholders. Its history of dividend payouts mean that STEF's TSR, which was a 24% drop over the last 3 years, was not as bad as the share price return.
A Different Perspective
While the broader market lost about 0.6% in the twelve months, STEF shareholders did even worse, losing 13%. Having said that, it's inevitable that some stocks will be oversold in a falling market. The key is to keep your eyes on the fundamental developments. Longer term investors wouldn't be so upset, since they would have made 4.4%, each year, over five years. It could be that the recent sell-off is an opportunity, so it may be worth checking the fundamental data for signs of a long term growth trend. It's always interesting to track share price performance over the longer term. But to understand STEF better, we need to consider many other factors. For instance, we've identified 1 warning sign for STEF that you should be aware of.
Of course, you might find a fantastic investment by looking elsewhere. So take a peek at this free list of companies we expect will grow earnings.
Please note, the market returns quoted in this article reflect the market weighted average returns of stocks that currently trade on FR exchanges.
If you decide to trade STEF, use the lowest-cost* platform that is rated #1 Overall by Barron’s, Interactive Brokers. Trade stocks, options, futures, forex, bonds and funds on 135 markets, all from a single integrated account. Promoted
New: Manage All Your Stock Portfolios in One Place
We've created the ultimate portfolio companion for stock investors, and it's free.
• Connect an unlimited number of Portfolios and see your total in one currency
• Be alerted to new Warning Signs or Risks via email or mobile
• Track the Fair Value of your stocks
This article by Simply Wall St is general in nature. It does not constitute a recommendation to buy or sell any stock, and does not take account of your objectives, or your financial situation. We aim to bring you long-term focused analysis driven by fundamental data. Note that our analysis may not factor in the latest price-sensitive company announcements or qualitative material. Simply Wall St has no position in any stocks mentioned.
*Interactive Brokers Rated Lowest Cost Broker by StockBrokers.com Annual Online Review 2020
Have feedback on this article? Concerned about the content? Get in touch with us directly. Alternatively, email editorial-team@simplywallst.com.
About ENXTPA:STF
STEF
Provides temperature-controlled road transport and logistics services for agri-food industry, and out-of-home foodservices.
Undervalued with adequate balance sheet.
Similar Companies
Market Insights

Advertisement
Community Narratives
The Future of Drug Testing? Fingerprint Tech Shows Serious Promise
Fair Value US$2.98|33.6% undervalued
JO
Community Contributor
Occidental Petroleum is set to achieve a 16% profit margin improvement
Fair Value US$55.05|18.5% undervalued
DZ
Community Contributor
Argan's Revenue Set to Soar with a 13.31% Growth in the Coming Decade
Fair Value US$284.68|21.2% undervalued
KE
Community Contributor
EU#1 - From German Startup to EU’s Biggest Company
Fair Value €248.62|5.8% overvalued
TO
Community Contributor