How Much Did L.G. Balakrishnan & Bros'(NSE:LGBBROSLTD) Shareholders Earn From Share Price Movements Over The Last Three Years?


As an investor its worth striving to ensure your overall portfolio beats the market average. But the risk of stock picking is that you will likely buy under-performing companies. We regret to report that long term L.G. Balakrishnan & Bros Limited (NSE:LGBBROSLTD) shareholders have had that experience, with the share price dropping 48% in three years, versus a market decline of about 2.6%.
View our latest analysis for L.G. Balakrishnan & Bros
To quote Buffett, 'Ships will sail around the world but the Flat Earth Society will flourish. There will continue to be wide discrepancies between price and value in the marketplace...' One way to examine how market sentiment has changed over time is to look at the interaction between a company's share price and its earnings per share (EPS).
During the unfortunate three years of share price decline, L.G. Balakrishnan & Bros actually saw its earnings per share (EPS) improve by 0.1% per year. This is quite a puzzle, and suggests there might be something temporarily buoying the share price. Alternatively, growth expectations may have been unreasonable in the past.
After considering the numbers, we'd posit that the the market had higher expectations of EPS growth, three years back. However, taking a look at other business metrics might shed a bit more light on the share price action.
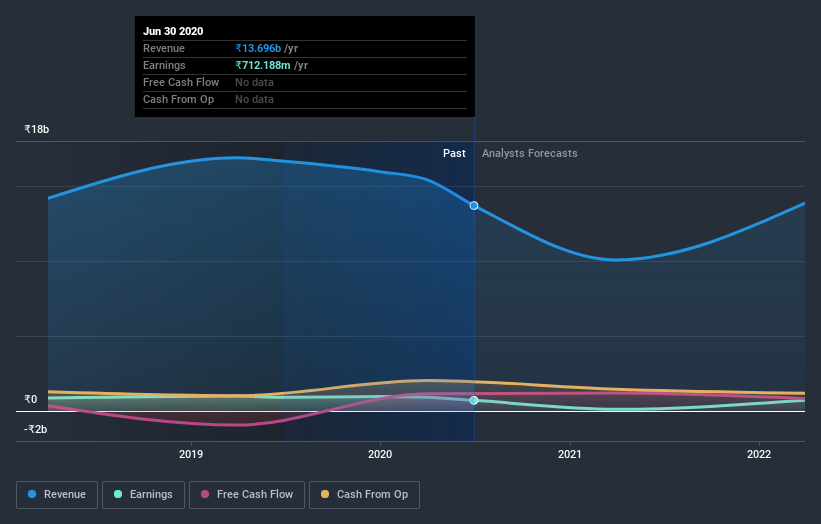
With revenue flat over three years, it seems unlikely that the share price is reflecting the top line. We're not entirely sure why the share price is dropped, but it does seem likely investors have become less optimistic about the business.
The image below shows how earnings and revenue have tracked over time (if you click on the image you can see greater detail).
This free interactive report on L.G. Balakrishnan & Bros' balance sheet strength is a great place to start, if you want to investigate the stock further.
What About Dividends?
As well as measuring the share price return, investors should also consider the total shareholder return (TSR). Whereas the share price return only reflects the change in the share price, the TSR includes the value of dividends (assuming they were reinvested) and the benefit of any discounted capital raising or spin-off. It's fair to say that the TSR gives a more complete picture for stocks that pay a dividend. As it happens, L.G. Balakrishnan & Bros' TSR for the last 3 years was -46%, which exceeds the share price return mentioned earlier. This is largely a result of its dividend payments!
A Different Perspective
L.G. Balakrishnan & Bros shareholders are down 9.9% for the year (even including dividends), but the market itself is up 3.9%. Even the share prices of good stocks drop sometimes, but we want to see improvements in the fundamental metrics of a business, before getting too interested. On the bright side, long term shareholders have made money, with a gain of 0.8% per year over half a decade. If the fundamental data continues to indicate long term sustainable growth, the current sell-off could be an opportunity worth considering. It's always interesting to track share price performance over the longer term. But to understand L.G. Balakrishnan & Bros better, we need to consider many other factors. For instance, we've identified 3 warning signs for L.G. Balakrishnan & Bros that you should be aware of.
Of course, you might find a fantastic investment by looking elsewhere. So take a peek at this free list of companies we expect will grow earnings.
Please note, the market returns quoted in this article reflect the market weighted average returns of stocks that currently trade on IN exchanges.
When trading L.G. Balakrishnan & Bros or any other investment, use the platform considered by many to be the Professional's Gateway to the Worlds Market, Interactive Brokers. You get the lowest-cost* trading on stocks, options, futures, forex, bonds and funds worldwide from a single integrated account. Promoted
New: AI Stock Screener & Alerts
Our new AI Stock Screener scans the market every day to uncover opportunities.
• Dividend Powerhouses (3%+ Yield)
• Undervalued Small Caps with Insider Buying
• High growth Tech and AI Companies
Or build your own from over 50 metrics.
This article by Simply Wall St is general in nature. It does not constitute a recommendation to buy or sell any stock, and does not take account of your objectives, or your financial situation. We aim to bring you long-term focused analysis driven by fundamental data. Note that our analysis may not factor in the latest price-sensitive company announcements or qualitative material. Simply Wall St has no position in any stocks mentioned.
*Interactive Brokers Rated Lowest Cost Broker by StockBrokers.com Annual Online Review 2020
Have feedback on this article? Concerned about the content? Get in touch with us directly. Alternatively, email editorial-team@simplywallst.com.
About NSEI:LGBBROSLTD
L.G. Balakrishnan & Bros
Manufactures and sells transmission chains, sprockets, and metal formed parts for automotive and industrial applications in India and internationally.
Flawless balance sheet established dividend payer.

