
Advertisement
Here's What Max Financial Services Limited's (NSE:MFSL) P/E Ratio Is Telling Us

This article is written for those who want to get better at using price to earnings ratios (P/E ratios). We'll look at Max Financial Services Limited's (NSE:MFSL) P/E ratio and reflect on what it tells us about the company's share price. Max Financial Services has a P/E ratio of 37.45, based on the last twelve months. In other words, at today's prices, investors are paying ₹37.45 for every ₹1 in prior year profit.
View our latest analysis for Max Financial Services
How Do You Calculate Max Financial Services's P/E Ratio?
The formula for P/E is:
Price to Earnings Ratio = Price per Share ÷ Earnings per Share (EPS)
Or for Max Financial Services:
P/E of 37.45 = ₹399.35 ÷ ₹10.66 (Based on the year to June 2019.)
Is A High P/E Ratio Good?
A higher P/E ratio means that investors are paying a higher price for each ₹1 of company earnings. That is not a good or a bad thing per se, but a high P/E does imply buyers are optimistic about the future.
Does Max Financial Services Have A Relatively High Or Low P/E For Its Industry?
One good way to get a quick read on what market participants expect of a company is to look at its P/E ratio. The image below shows that Max Financial Services has a lower P/E than the average (47.6) P/E for companies in the insurance industry.
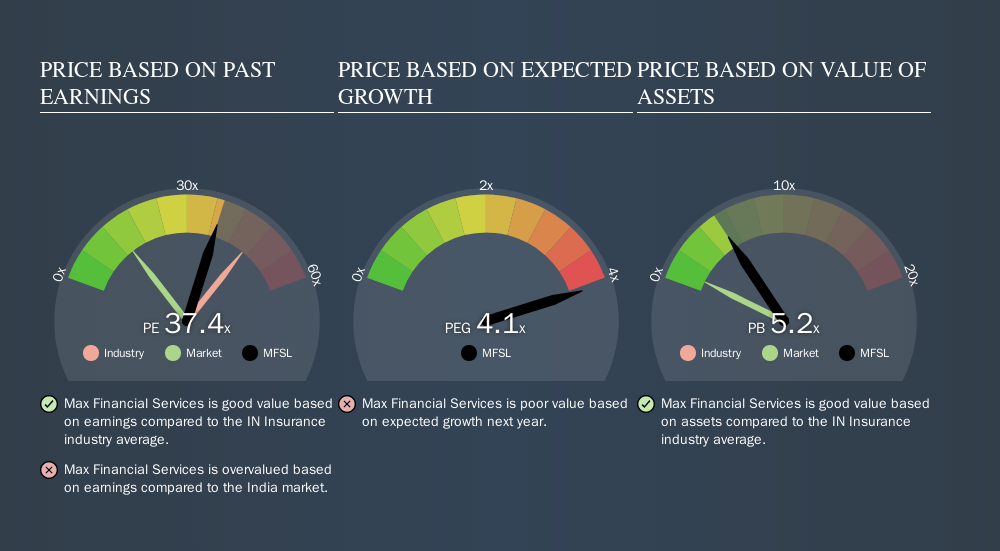
Max Financial Services's P/E tells us that market participants think it will not fare as well as its peers in the same industry. Since the market seems unimpressed with Max Financial Services, it's quite possible it could surprise on the upside. You should delve deeper. I like to check if company insiders have been buying or selling.
How Growth Rates Impact P/E Ratios
Earnings growth rates have a big influence on P/E ratios. When earnings grow, the 'E' increases, over time. Therefore, even if you pay a high multiple of earnings now, that multiple will become lower in the future. So while a stock may look expensive based on past earnings, it could be cheap based on future earnings.
Max Financial Services's earnings per share were pretty steady over the last year. But it has grown its earnings per share by 15% per year over the last five years.
A Limitation: P/E Ratios Ignore Debt and Cash In The Bank
It's important to note that the P/E ratio considers the market capitalization, not the enterprise value. That means it doesn't take debt or cash into account. Theoretically, a business can improve its earnings (and produce a lower P/E in the future) by investing in growth. That means taking on debt (or spending its cash).
Such spending might be good or bad, overall, but the key point here is that you need to look at debt to understand the P/E ratio in context.
So What Does Max Financial Services's Balance Sheet Tell Us?
Since Max Financial Services holds net cash of ₹5.1b, it can spend on growth, justifying a higher P/E ratio than otherwise.
The Verdict On Max Financial Services's P/E Ratio
Max Financial Services's P/E is 37.4 which is above average (13.6) in its market. Earnings improved over the last year. Also positive, the relatively strong balance sheet will allow for investment in growth -- and the P/E indicates shareholders that will happen!
Investors should be looking to buy stocks that the market is wrong about. If the reality for a company is better than it expects, you can make money by buying and holding for the long term. So this free report on the analyst consensus forecasts could help you make a master move on this stock.
Of course, you might find a fantastic investment by looking at a few good candidates. So take a peek at this free list of companies with modest (or no) debt, trading on a P/E below 20.
We aim to bring you long-term focused research analysis driven by fundamental data. Note that our analysis may not factor in the latest price-sensitive company announcements or qualitative material.
If you spot an error that warrants correction, please contact the editor at editorial-team@simplywallst.com. This article by Simply Wall St is general in nature. It does not constitute a recommendation to buy or sell any stock, and does not take account of your objectives, or your financial situation. Simply Wall St has no position in the stocks mentioned. Thank you for reading.
About NSEI:MFSL
Max Financial Services
Through its subsidiary, provides business investment and management advisory services in India.
Reasonable growth potential with mediocre balance sheet.
Market Insights

Advertisement
Community Narratives
The Future of Drug Testing? Fingerprint Tech Shows Serious Promise
Fair Value US$2.98|35.9% undervalued
JO
Community Contributor
Occidental Petroleum is set to achieve a 16% profit margin improvement
Fair Value US$55.05|15.6% undervalued
DZ
Community Contributor
Argan's Revenue Set to Soar with a 13.31% Growth in the Coming Decade
Fair Value US$284.68|23.4% undervalued
KE
Community Contributor
EU#1 - From German Startup to EU’s Biggest Company
Fair Value €248.62|2.5% overvalued
TO
Community Contributor