Does NACL Industries (NSE:NACLIND) Have A Healthy Balance Sheet?


David Iben put it well when he said, 'Volatility is not a risk we care about. What we care about is avoiding the permanent loss of capital. It's only natural to consider a company's balance sheet when you examine how risky it is, since debt is often involved when a business collapses. We can see that NACL Industries Limited (NSE:NACLIND) does use debt in its business. But the more important question is: how much risk is that debt creating?
When Is Debt A Problem?
Debt assists a business until the business has trouble paying it off, either with new capital or with free cash flow. In the worst case scenario, a company can go bankrupt if it cannot pay its creditors. While that is not too common, we often do see indebted companies permanently diluting shareholders because lenders force them to raise capital at a distressed price. Of course, debt can be an important tool in businesses, particularly capital heavy businesses. The first thing to do when considering how much debt a business uses is to look at its cash and debt together.
View our latest analysis for NACL Industries
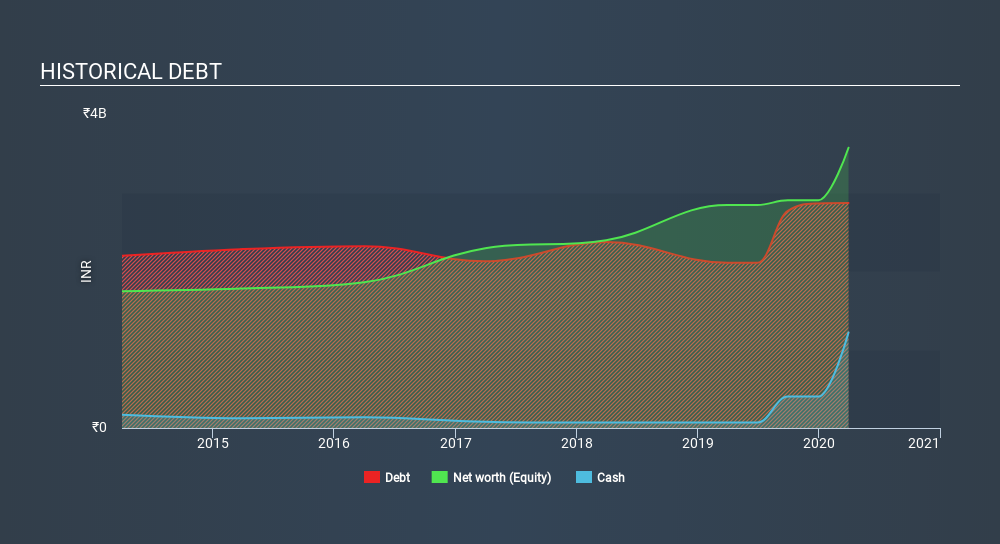
How Much Debt Does NACL Industries Carry?
As you can see below, at the end of March 2020, NACL Industries had ₹2.87b of debt, up from ₹2.10b a year ago. Click the image for more detail. However, it also had ₹1.22b in cash, and so its net debt is ₹1.65b.
How Healthy Is NACL Industries's Balance Sheet?
According to the last reported balance sheet, NACL Industries had liabilities of ₹5.53b due within 12 months, and liabilities of ₹441.9m due beyond 12 months. On the other hand, it had cash of ₹1.22b and ₹3.59b worth of receivables due within a year. So it has liabilities totalling ₹1.16b more than its cash and near-term receivables, combined.
Of course, NACL Industries has a market capitalization of ₹7.42b, so these liabilities are probably manageable. However, we do think it is worth keeping an eye on its balance sheet strength, as it may change over time.
In order to size up a company's debt relative to its earnings, we calculate its net debt divided by its earnings before interest, tax, depreciation, and amortization (EBITDA) and its earnings before interest and tax (EBIT) divided by its interest expense (its interest cover). The advantage of this approach is that we take into account both the absolute quantum of debt (with net debt to EBITDA) and the actual interest expenses associated with that debt (with its interest cover ratio).
Even though NACL Industries's debt is only 2.4, its interest cover is really very low at 1.5. This does have us wondering if the company pays high interest because it is considered risky. Either way there's no doubt the stock is using meaningful leverage. One redeeming factor for NACL Industries is that it turned last year's EBIT loss into a gain of ₹446m, over the last twelve months. The balance sheet is clearly the area to focus on when you are analysing debt. But you can't view debt in total isolation; since NACL Industries will need earnings to service that debt. So when considering debt, it's definitely worth looking at the earnings trend. Click here for an interactive snapshot.
Finally, while the tax-man may adore accounting profits, lenders only accept cold hard cash. So it's worth checking how much of the earnings before interest and tax (EBIT) is backed by free cash flow. Happily for any shareholders, NACL Industries actually produced more free cash flow than EBIT over the last year. There's nothing better than incoming cash when it comes to staying in your lenders' good graces.
Our View
On our analysis NACL Industries's conversion of EBIT to free cash flow should signal that it won't have too much trouble with its debt. But the other factors we noted above weren't so encouraging. In particular, interest cover gives us cold feet. When we consider all the elements mentioned above, it seems to us that NACL Industries is managing its debt quite well. Having said that, the load is sufficiently heavy that we would recommend any shareholders keep a close eye on it. The balance sheet is clearly the area to focus on when you are analysing debt. But ultimately, every company can contain risks that exist outside of the balance sheet. Consider for instance, the ever-present spectre of investment risk. We've identified 5 warning signs with NACL Industries (at least 2 which shouldn't be ignored) , and understanding them should be part of your investment process.
If, after all that, you're more interested in a fast growing company with a rock-solid balance sheet, then check out our list of net cash growth stocks without delay.
If you decide to trade NACL Industries, use the lowest-cost* platform that is rated #1 Overall by Barron’s, Interactive Brokers. Trade stocks, options, futures, forex, bonds and funds on 135 markets, all from a single integrated account.Promoted
Valuation is complex, but we're here to simplify it.
Discover if NACL Industries might be undervalued or overvalued with our detailed analysis, featuring fair value estimates, potential risks, dividends, insider trades, and its financial condition.
Access Free AnalysisThis article by Simply Wall St is general in nature. It does not constitute a recommendation to buy or sell any stock, and does not take account of your objectives, or your financial situation. We aim to bring you long-term focused analysis driven by fundamental data. Note that our analysis may not factor in the latest price-sensitive company announcements or qualitative material. Simply Wall St has no position in any stocks mentioned.
*Interactive Brokers Rated Lowest Cost Broker by StockBrokers.com Annual Online Review 2020
Have feedback on this article? Concerned about the content? Get in touch with us directly. Alternatively, email editorial-team@simplywallst.com.
About NSEI:NACLIND
Good value with mediocre balance sheet.

