
Advertisement
- United States
- /
- Commercial Services
- /
- NYSE:SCS
Do You Know What Steelcase Inc.'s (NYSE:SCS) P/E Ratio Means?

The goal of this article is to teach you how to use price to earnings ratios (P/E ratios). We'll apply a basic P/E ratio analysis to Steelcase Inc.'s (NYSE:SCS), to help you decide if the stock is worth further research. Steelcase has a price to earnings ratio of 16.53, based on the last twelve months. In other words, at today's prices, investors are paying $16.53 for every $1 in prior year profit.
See our latest analysis for Steelcase
How Do I Calculate A Price To Earnings Ratio?
The formula for price to earnings is:
Price to Earnings Ratio = Price per Share ÷ Earnings per Share (EPS)
Or for Steelcase:
P/E of 16.53 = $19.14 ÷ $1.16 (Based on the trailing twelve months to August 2019.)
Is A High Price-to-Earnings Ratio Good?
The higher the P/E ratio, the higher the price tag of a business, relative to its trailing earnings. That isn't a good or a bad thing on its own, but a high P/E means that buyers have a higher opinion of the business's prospects, relative to stocks with a lower P/E.
Does Steelcase Have A Relatively High Or Low P/E For Its Industry?
We can get an indication of market expectations by looking at the P/E ratio. We can see in the image below that the average P/E (25.2) for companies in the commercial services industry is higher than Steelcase's P/E.
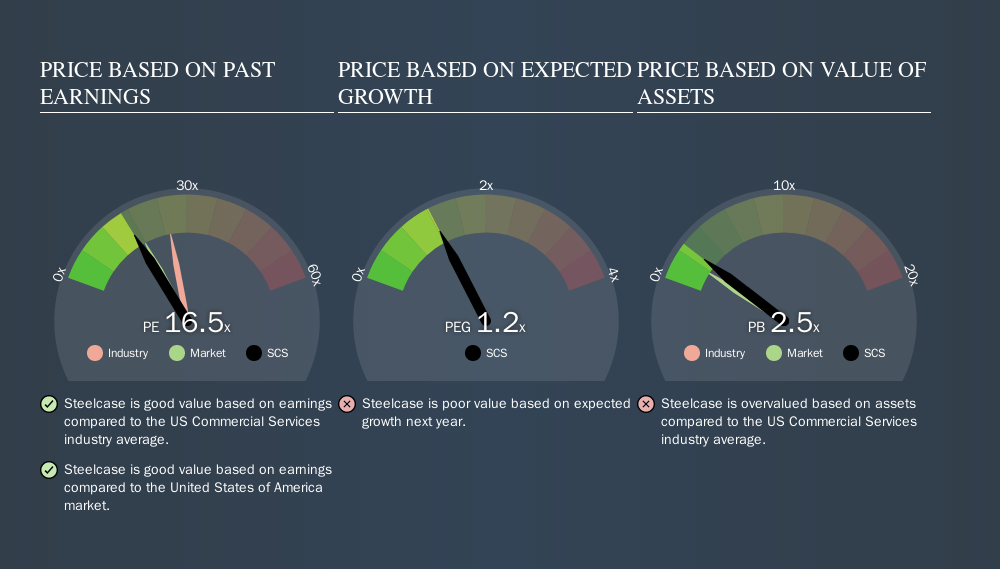
This suggests that market participants think Steelcase will underperform other companies in its industry.
How Growth Rates Impact P/E Ratios
Companies that shrink earnings per share quickly will rapidly decrease the 'E' in the equation. Therefore, even if you pay a low multiple of earnings now, that multiple will become higher in the future. A higher P/E should indicate the stock is expensive relative to others -- and that may encourage shareholders to sell.
Steelcase's earnings made like a rocket, taking off 50% last year. Unfortunately, earnings per share are down 5.9% a year, over 3 years. The market might expect further growth, but it isn't guaranteed. So further research is always essential. I often monitor director buying and selling.
Remember: P/E Ratios Don't Consider The Balance Sheet
It's important to note that the P/E ratio considers the market capitalization, not the enterprise value. In other words, it does not consider any debt or cash that the company may have on the balance sheet. Hypothetically, a company could reduce its future P/E ratio by spending its cash (or taking on debt) to achieve higher earnings.
Such spending might be good or bad, overall, but the key point here is that you need to look at debt to understand the P/E ratio in context.
So What Does Steelcase's Balance Sheet Tell Us?
Steelcase's net debt is 11% of its market cap. This could bring some additional risk, and reduce the number of investment options for management; worth remembering if you compare its P/E to businesses without debt.
The Bottom Line On Steelcase's P/E Ratio
Steelcase's P/E is 16.5 which is below average (18.0) in the US market. The company hasn't stretched its balance sheet, and earnings growth was good last year. If it continues to grow, then the current low P/E may prove to be unjustified. Given analysts are expecting further growth, one might have expected a higher P/E ratio. That may be worth further research.
Investors have an opportunity when market expectations about a stock are wrong. If it is underestimating a company, investors can make money by buying and holding the shares until the market corrects itself. So this free visualization of the analyst consensus on future earnings could help you make the right decision about whether to buy, sell, or hold.
You might be able to find a better buy than Steelcase. If you want a selection of possible winners, check out this free list of interesting companies that trade on a P/E below 20 (but have proven they can grow earnings).
We aim to bring you long-term focused research analysis driven by fundamental data. Note that our analysis may not factor in the latest price-sensitive company announcements or qualitative material.
If you spot an error that warrants correction, please contact the editor at editorial-team@simplywallst.com. This article by Simply Wall St is general in nature. It does not constitute a recommendation to buy or sell any stock, and does not take account of your objectives, or your financial situation. Simply Wall St has no position in the stocks mentioned. Thank you for reading.
About NYSE:SCS
Steelcase
Provides a portfolio of furniture and architectural products and services in the United States and internationally.
Very undervalued with flawless balance sheet.
Similar Companies
Market Insights

Advertisement
Community Narratives
Vita Life Sciences Set for a 12.72% Revenue Growth While Tackling Operational Challenges
Fair Value AU$2.42|9.1% undervalued
RO
Community Contributor
Vossloh rides a €500 billion wave to boost growth and earnings in the next decade
Fair Value €78.41|5.2% undervalued
CH
Community Contributor
Intuitive Surgical Will Transform Healthcare with 12% Revenue Growth
Fair Value US$325.55|57.3% overvalued
UN
Community Contributor