Stock Analysis
- Taiwan
- /
- Electronic Equipment and Components
- /
- TWSE:3321
We Think Uniflex Technology (TWSE:3321) Has A Fair Chunk Of Debt

David Iben put it well when he said, 'Volatility is not a risk we care about. What we care about is avoiding the permanent loss of capital.' So it might be obvious that you need to consider debt, when you think about how risky any given stock is, because too much debt can sink a company. As with many other companies Uniflex Technology Inc. (TWSE:3321) makes use of debt. But is this debt a concern to shareholders?
When Is Debt A Problem?
Debt is a tool to help businesses grow, but if a business is incapable of paying off its lenders, then it exists at their mercy. In the worst case scenario, a company can go bankrupt if it cannot pay its creditors. While that is not too common, we often do see indebted companies permanently diluting shareholders because lenders force them to raise capital at a distressed price. Having said that, the most common situation is where a company manages its debt reasonably well - and to its own advantage. When we think about a company's use of debt, we first look at cash and debt together.
See our latest analysis for Uniflex Technology
What Is Uniflex Technology's Debt?
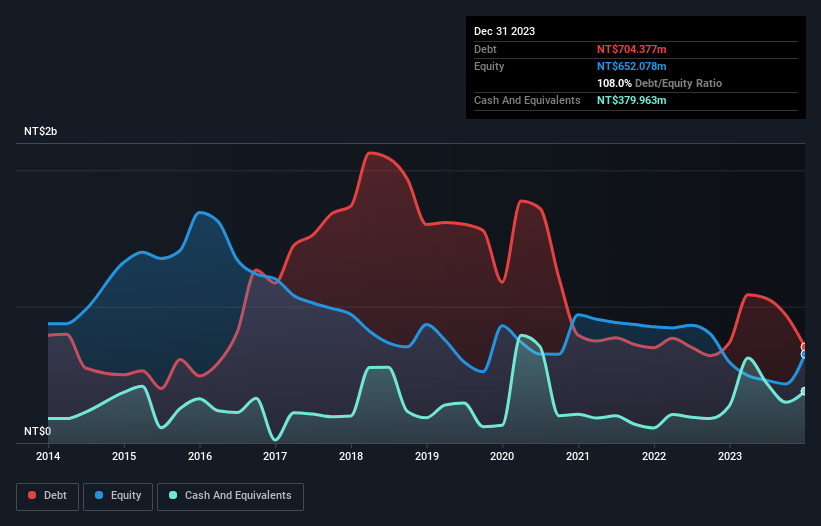
You can click the graphic below for the historical numbers, but it shows that Uniflex Technology had NT$704.4m of debt in December 2023, down from NT$734.4m, one year before. However, because it has a cash reserve of NT$380.0m, its net debt is less, at about NT$324.4m.
How Healthy Is Uniflex Technology's Balance Sheet?
The latest balance sheet data shows that Uniflex Technology had liabilities of NT$1.01b due within a year, and liabilities of NT$279.0m falling due after that. On the other hand, it had cash of NT$380.0m and NT$682.7m worth of receivables due within a year. So its liabilities outweigh the sum of its cash and (near-term) receivables by NT$224.1m.
Of course, Uniflex Technology has a market capitalization of NT$1.83b, so these liabilities are probably manageable. Having said that, it's clear that we should continue to monitor its balance sheet, lest it change for the worse. The balance sheet is clearly the area to focus on when you are analysing debt. But you can't view debt in total isolation; since Uniflex Technology will need earnings to service that debt. So when considering debt, it's definitely worth looking at the earnings trend. Click here for an interactive snapshot.
In the last year Uniflex Technology had a loss before interest and tax, and actually shrunk its revenue by 7.7%, to NT$1.5b. That's not what we would hope to see.
Caveat Emptor
Importantly, Uniflex Technology had an earnings before interest and tax (EBIT) loss over the last year. Indeed, it lost a very considerable NT$285m at the EBIT level. When we look at that and recall the liabilities on its balance sheet, relative to cash, it seems unwise to us for the company to have any debt. So we think its balance sheet is a little strained, though not beyond repair. However, it doesn't help that it burned through NT$111m of cash over the last year. So suffice it to say we consider the stock very risky. There's no doubt that we learn most about debt from the balance sheet. But ultimately, every company can contain risks that exist outside of the balance sheet. To that end, you should learn about the 3 warning signs we've spotted with Uniflex Technology (including 1 which is concerning) .
At the end of the day, it's often better to focus on companies that are free from net debt. You can access our special list of such companies (all with a track record of profit growth). It's free.
Valuation is complex, but we're helping make it simple.
Find out whether Uniflex Technology is potentially over or undervalued by checking out our comprehensive analysis, which includes fair value estimates, risks and warnings, dividends, insider transactions and financial health.
View the Free AnalysisHave feedback on this article? Concerned about the content? Get in touch with us directly. Alternatively, email editorial-team (at) simplywallst.com.
This article by Simply Wall St is general in nature. We provide commentary based on historical data and analyst forecasts only using an unbiased methodology and our articles are not intended to be financial advice. It does not constitute a recommendation to buy or sell any stock, and does not take account of your objectives, or your financial situation. We aim to bring you long-term focused analysis driven by fundamental data. Note that our analysis may not factor in the latest price-sensitive company announcements or qualitative material. Simply Wall St has no position in any stocks mentioned.

Simply Wall St
About TWSE:3321
Uniflex Technology
Uniflex Technology Inc. engages in the design, manufacture, and sale of flexible printed circuit (FPC) boards in Taiwan.
Mediocre balance sheet and slightly overvalued.
