Stock Analysis
- France
- /
- Electronic Equipment and Components
- /
- ENXTPA:VU
VusionGroup's (EPA:VU) Returns On Capital Are Heading Higher

What are the early trends we should look for to identify a stock that could multiply in value over the long term? Firstly, we'd want to identify a growing return on capital employed (ROCE) and then alongside that, an ever-increasing base of capital employed. Put simply, these types of businesses are compounding machines, meaning they are continually reinvesting their earnings at ever-higher rates of return. So when we looked at VusionGroup (EPA:VU) and its trend of ROCE, we really liked what we saw.
What Is Return On Capital Employed (ROCE)?
For those who don't know, ROCE is a measure of a company's yearly pre-tax profit (its return), relative to the capital employed in the business. To calculate this metric for VusionGroup, this is the formula:
Return on Capital Employed = Earnings Before Interest and Tax (EBIT) ÷ (Total Assets - Current Liabilities)
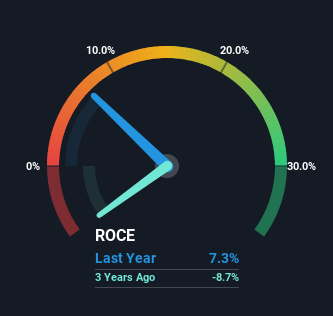
0.073 = €38m ÷ (€1.0b - €492m) (Based on the trailing twelve months to June 2023).
Thus, VusionGroup has an ROCE of 7.3%. On its own that's a low return on capital but it's in line with the industry's average returns of 7.3%.
View our latest analysis for VusionGroup
In the above chart we have measured VusionGroup's prior ROCE against its prior performance, but the future is arguably more important. If you'd like, you can check out the forecasts from the analysts covering VusionGroup for free.
What Does the ROCE Trend For VusionGroup Tell Us?
VusionGroup has recently broken into profitability so their prior investments seem to be paying off. The company was generating losses five years ago, but now it's earning 7.3% which is a sight for sore eyes. Not only that, but the company is utilizing 141% more capital than before, but that's to be expected from a company trying to break into profitability. We like this trend, because it tells us the company has profitable reinvestment opportunities available to it, and if it continues going forward that can lead to a multi-bagger performance.
On a side note, we noticed that the improvement in ROCE appears to be partly fueled by an increase in current liabilities. Essentially the business now has suppliers or short-term creditors funding about 49% of its operations, which isn't ideal. Given it's pretty high ratio, we'd remind investors that having current liabilities at those levels can bring about some risks in certain businesses.
In Conclusion...
Overall, VusionGroup gets a big tick from us thanks in most part to the fact that it is now profitable and is reinvesting in its business. And a remarkable 388% total return over the last five years tells us that investors are expecting more good things to come in the future. Therefore, we think it would be worth your time to check if these trends are going to continue.
While VusionGroup looks impressive, no company is worth an infinite price. The intrinsic value infographic for VU helps visualize whether it is currently trading for a fair price.
For those who like to invest in solid companies, check out this free list of companies with solid balance sheets and high returns on equity.
Valuation is complex, but we're helping make it simple.
Find out whether VusionGroup is potentially over or undervalued by checking out our comprehensive analysis, which includes fair value estimates, risks and warnings, dividends, insider transactions and financial health.
View the Free AnalysisHave feedback on this article? Concerned about the content? Get in touch with us directly. Alternatively, email editorial-team (at) simplywallst.com.
This article by Simply Wall St is general in nature. We provide commentary based on historical data and analyst forecasts only using an unbiased methodology and our articles are not intended to be financial advice. It does not constitute a recommendation to buy or sell any stock, and does not take account of your objectives, or your financial situation. We aim to bring you long-term focused analysis driven by fundamental data. Note that our analysis may not factor in the latest price-sensitive company announcements or qualitative material. Simply Wall St has no position in any stocks mentioned.

Simply Wall St
About ENXTPA:VU
VusionGroup
VusionGroup S.A. provides digitalization solutions for commerce in Europe, Asia, and North America.
Outstanding track record with high growth potential.
