Stock Analysis
- South Africa
- /
- Wireless Telecom
- /
- JSE:VOD
Vodacom Group (JSE:VOD) earnings and shareholder returns have been trending downwards for the last three years, but the stock rises 3.2% this past week


Many investors define successful investing as beating the market average over the long term. But if you try your hand at stock picking, your risk returning less than the market. We regret to report that long term Vodacom Group Limited (JSE:VOD) shareholders have had that experience, with the share price dropping 26% in three years, versus a market decline of about 13%.
While the last three years has been tough for Vodacom Group shareholders, this past week has shown signs of promise. So let's look at the longer term fundamentals and see if they've been the driver of the negative returns.
View our latest analysis for Vodacom Group
To quote Buffett, 'Ships will sail around the world but the Flat Earth Society will flourish. There will continue to be wide discrepancies between price and value in the marketplace...' One flawed but reasonable way to assess how sentiment around a company has changed is to compare the earnings per share (EPS) with the share price.
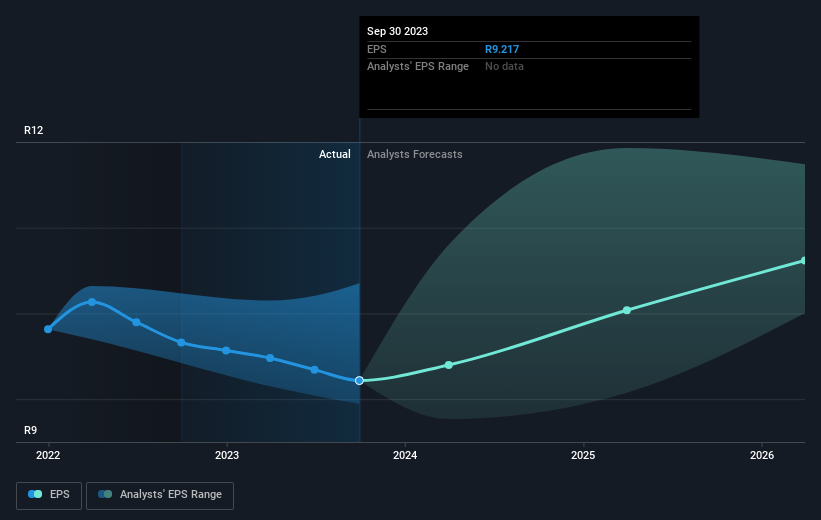
Vodacom Group saw its EPS decline at a compound rate of 3.8% per year, over the last three years. The share price decline of 9% is actually steeper than the EPS slippage. So it seems the market was too confident about the business, in the past. This increased caution is also evident in the rather low P/E ratio, which is sitting at 10.77.
You can see how EPS has changed over time in the image below (click on the chart to see the exact values).
It might be well worthwhile taking a look at our free report on Vodacom Group's earnings, revenue and cash flow.
What About Dividends?
As well as measuring the share price return, investors should also consider the total shareholder return (TSR). The TSR incorporates the value of any spin-offs or discounted capital raisings, along with any dividends, based on the assumption that the dividends are reinvested. Arguably, the TSR gives a more comprehensive picture of the return generated by a stock. In the case of Vodacom Group, it has a TSR of -11% for the last 3 years. That exceeds its share price return that we previously mentioned. The dividends paid by the company have thusly boosted the total shareholder return.
A Different Perspective
While the broader market gained around 3.2% in the last year, Vodacom Group shareholders lost 17% (even including dividends). Even the share prices of good stocks drop sometimes, but we want to see improvements in the fundamental metrics of a business, before getting too interested. On the bright side, long term shareholders have made money, with a gain of 4% per year over half a decade. It could be that the recent sell-off is an opportunity, so it may be worth checking the fundamental data for signs of a long term growth trend. I find it very interesting to look at share price over the long term as a proxy for business performance. But to truly gain insight, we need to consider other information, too. For instance, we've identified 2 warning signs for Vodacom Group that you should be aware of.
If you are like me, then you will not want to miss this free list of growing companies that insiders are buying.
Please note, the market returns quoted in this article reflect the market weighted average returns of stocks that currently trade on South African exchanges.
Valuation is complex, but we're helping make it simple.
Find out whether Vodacom Group is potentially over or undervalued by checking out our comprehensive analysis, which includes fair value estimates, risks and warnings, dividends, insider transactions and financial health.
View the Free AnalysisHave feedback on this article? Concerned about the content? Get in touch with us directly. Alternatively, email editorial-team (at) simplywallst.com.
This article by Simply Wall St is general in nature. We provide commentary based on historical data and analyst forecasts only using an unbiased methodology and our articles are not intended to be financial advice. It does not constitute a recommendation to buy or sell any stock, and does not take account of your objectives, or your financial situation. We aim to bring you long-term focused analysis driven by fundamental data. Note that our analysis may not factor in the latest price-sensitive company announcements or qualitative material. Simply Wall St has no position in any stocks mentioned.
About JSE:VOD
Vodacom Group
Vodacom Group Limited operates as a connectivity, digital, and financial services company in South Africa and internationally.
Very undervalued with solid track record.
