David Iben put it well when he said, 'Volatility is not a risk we care about. What we care about is avoiding the permanent loss of capital.' So it seems the smart money knows that debt - which is usually involved in bankruptcies - is a very important factor, when you assess how risky a company is. As with many other companies VEEM Ltd (ASX:VEE) makes use of debt. But should shareholders be worried about its use of debt?
What Risk Does Debt Bring?
Generally speaking, debt only becomes a real problem when a company can't easily pay it off, either by raising capital or with its own cash flow. Ultimately, if the company can't fulfill its legal obligations to repay debt, shareholders could walk away with nothing. However, a more usual (but still expensive) situation is where a company must dilute shareholders at a cheap share price simply to get debt under control. Of course, the upside of debt is that it often represents cheap capital, especially when it replaces dilution in a company with the ability to reinvest at high rates of return. When we examine debt levels, we first consider both cash and debt levels, together.
View our latest analysis for VEEM
What Is VEEM's Net Debt?
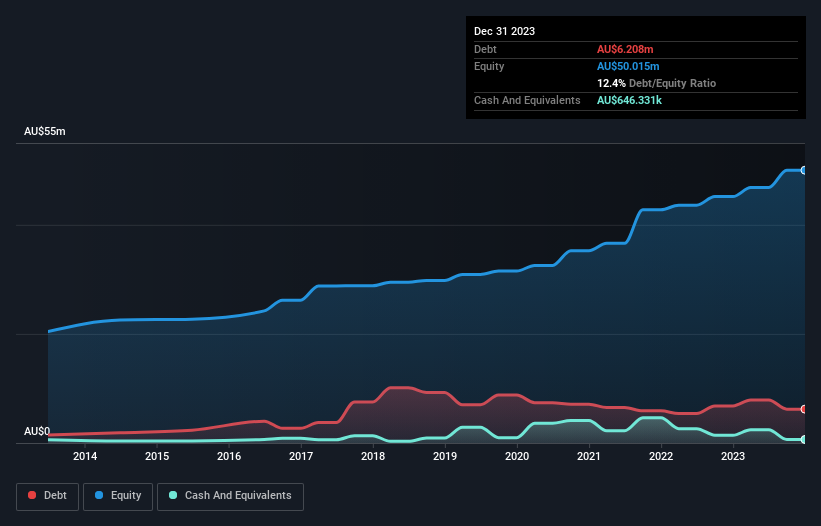
You can click the graphic below for the historical numbers, but it shows that VEEM had AU$6.21m of debt in December 2023, down from AU$6.80m, one year before. However, it also had AU$646.3k in cash, and so its net debt is AU$5.56m.
How Strong Is VEEM's Balance Sheet?
Zooming in on the latest balance sheet data, we can see that VEEM had liabilities of AU$17.4m due within 12 months and liabilities of AU$26.4m due beyond that. Offsetting this, it had AU$646.3k in cash and AU$12.8m in receivables that were due within 12 months. So it has liabilities totalling AU$30.3m more than its cash and near-term receivables, combined.
Since publicly traded VEEM shares are worth a total of AU$242.3m, it seems unlikely that this level of liabilities would be a major threat. Having said that, it's clear that we should continue to monitor its balance sheet, lest it change for the worse.
We measure a company's debt load relative to its earnings power by looking at its net debt divided by its earnings before interest, tax, depreciation, and amortization (EBITDA) and by calculating how easily its earnings before interest and tax (EBIT) cover its interest expense (interest cover). This way, we consider both the absolute quantum of the debt, as well as the interest rates paid on it.
Looking at its net debt to EBITDA of 0.58 and interest cover of 6.6 times, it seems to us that VEEM is probably using debt in a pretty reasonable way. So we'd recommend keeping a close eye on the impact financing costs are having on the business. Better yet, VEEM grew its EBIT by 112% last year, which is an impressive improvement. If maintained that growth will make the debt even more manageable in the years ahead. There's no doubt that we learn most about debt from the balance sheet. But ultimately the future profitability of the business will decide if VEEM can strengthen its balance sheet over time. So if you're focused on the future you can check out this free report showing analyst profit forecasts.
Finally, a company can only pay off debt with cold hard cash, not accounting profits. So it's worth checking how much of that EBIT is backed by free cash flow. In the last three years, VEEM created free cash flow amounting to 6.8% of its EBIT, an uninspiring performance. For us, cash conversion that low sparks a little paranoia about is ability to extinguish debt.
Our View
VEEM's EBIT growth rate suggests it can handle its debt as easily as Cristiano Ronaldo could score a goal against an under 14's goalkeeper. But we must concede we find its conversion of EBIT to free cash flow has the opposite effect. All these things considered, it appears that VEEM can comfortably handle its current debt levels. Of course, while this leverage can enhance returns on equity, it does bring more risk, so it's worth keeping an eye on this one. Over time, share prices tend to follow earnings per share, so if you're interested in VEEM, you may well want to click here to check an interactive graph of its earnings per share history.
If, after all that, you're more interested in a fast growing company with a rock-solid balance sheet, then check out our list of net cash growth stocks without delay.
Valuation is complex, but we're helping make it simple.
Find out whether VEEM is potentially over or undervalued by checking out our comprehensive analysis, which includes fair value estimates, risks and warnings, dividends, insider transactions and financial health.
View the Free AnalysisHave feedback on this article? Concerned about the content? Get in touch with us directly. Alternatively, email editorial-team (at) simplywallst.com.
This article by Simply Wall St is general in nature. We provide commentary based on historical data and analyst forecasts only using an unbiased methodology and our articles are not intended to be financial advice. It does not constitute a recommendation to buy or sell any stock, and does not take account of your objectives, or your financial situation. We aim to bring you long-term focused analysis driven by fundamental data. Note that our analysis may not factor in the latest price-sensitive company announcements or qualitative material. Simply Wall St has no position in any stocks mentioned.

Simply Wall St
About ASX:VEE
VEEM
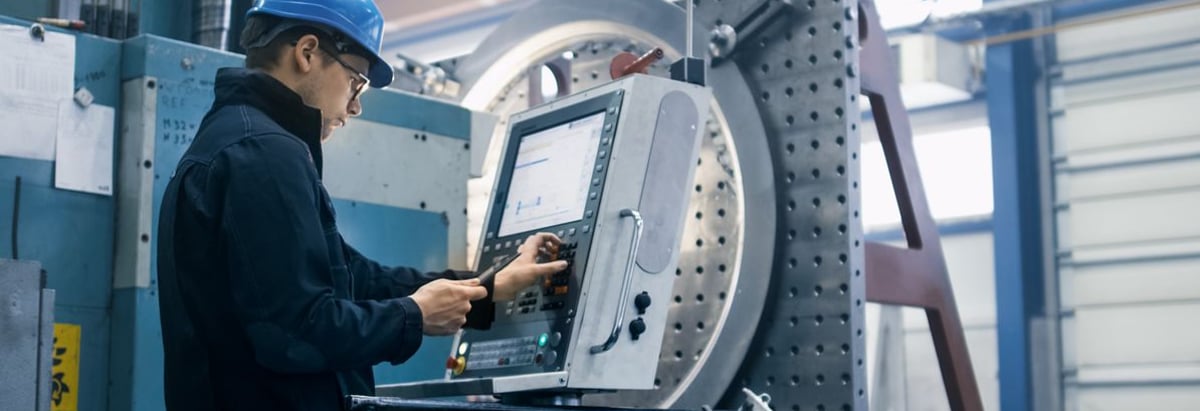
VEEM Ltd engages in the manufacture and sale of marine propulsion and stabilization systems.
Flawless balance sheet with solid track record.
