Stock Analysis
Those who invested in CSL (ASX:CSL) five years ago are up 51%


When we invest, we're generally looking for stocks that outperform the market average. And while active stock picking involves risks (and requires diversification) it can also provide excess returns. For example, the CSL Limited (ASX:CSL) share price is up 42% in the last 5 years, clearly besting the market return of around 24% (ignoring dividends).
So let's assess the underlying fundamentals over the last 5 years and see if they've moved in lock-step with shareholder returns.
See our latest analysis for CSL
While markets are a powerful pricing mechanism, share prices reflect investor sentiment, not just underlying business performance. One way to examine how market sentiment has changed over time is to look at the interaction between a company's share price and its earnings per share (EPS).
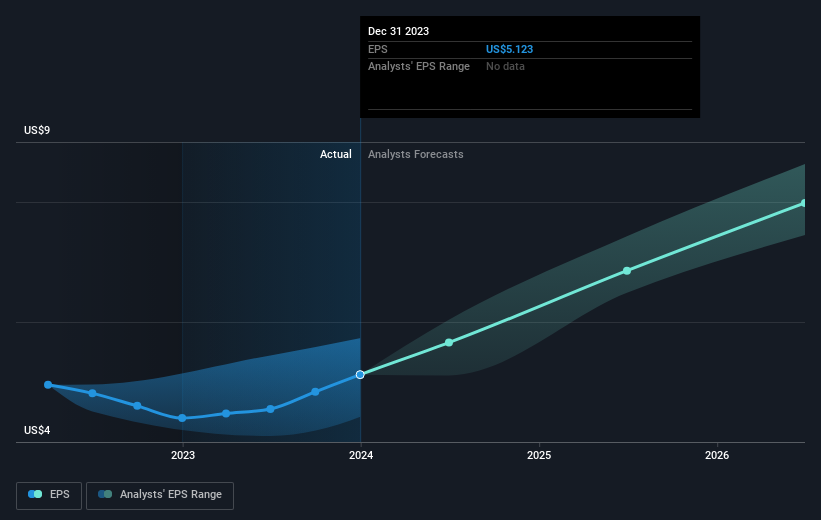
Over half a decade, CSL managed to grow its earnings per share at 5.1% a year. This EPS growth is slower than the share price growth of 7% per year, over the same period. This suggests that market participants hold the company in higher regard, these days. That's not necessarily surprising considering the five-year track record of earnings growth.
The graphic below depicts how EPS has changed over time (unveil the exact values by clicking on the image).
We know that CSL has improved its bottom line lately, but is it going to grow revenue? Check if analysts think CSL will grow revenue in the future.
What About Dividends?
As well as measuring the share price return, investors should also consider the total shareholder return (TSR). The TSR incorporates the value of any spin-offs or discounted capital raisings, along with any dividends, based on the assumption that the dividends are reinvested. So for companies that pay a generous dividend, the TSR is often a lot higher than the share price return. As it happens, CSL's TSR for the last 5 years was 51%, which exceeds the share price return mentioned earlier. This is largely a result of its dividend payments!
A Different Perspective
CSL shareholders are down 5.9% for the year (even including dividends), but the market itself is up 13%. Even the share prices of good stocks drop sometimes, but we want to see improvements in the fundamental metrics of a business, before getting too interested. On the bright side, long term shareholders have made money, with a gain of 9% per year over half a decade. It could be that the recent sell-off is an opportunity, so it may be worth checking the fundamental data for signs of a long term growth trend. It's always interesting to track share price performance over the longer term. But to understand CSL better, we need to consider many other factors. Take risks, for example - CSL has 1 warning sign we think you should be aware of.
For those who like to find winning investments this free list of growing companies with recent insider purchasing, could be just the ticket.
Please note, the market returns quoted in this article reflect the market weighted average returns of stocks that currently trade on Australian exchanges.
Valuation is complex, but we're helping make it simple.
Find out whether CSL is potentially over or undervalued by checking out our comprehensive analysis, which includes fair value estimates, risks and warnings, dividends, insider transactions and financial health.
View the Free AnalysisHave feedback on this article? Concerned about the content? Get in touch with us directly. Alternatively, email editorial-team (at) simplywallst.com.
This article by Simply Wall St is general in nature. We provide commentary based on historical data and analyst forecasts only using an unbiased methodology and our articles are not intended to be financial advice. It does not constitute a recommendation to buy or sell any stock, and does not take account of your objectives, or your financial situation. We aim to bring you long-term focused analysis driven by fundamental data. Note that our analysis may not factor in the latest price-sensitive company announcements or qualitative material. Simply Wall St has no position in any stocks mentioned.
About ASX:CSL
CSL
CSL Limited researches, develops, manufactures, markets, and distributes biopharmaceutical and vaccines in Australia, the United States, Germany, the United Kingdom, Switzerland, China, and internationally.
Good value with proven track record.
