Stock Analysis
- India
- /
- Auto Components
- /
- NSEI:TALBROAUTO
The Market Lifts Talbros Automotive Components Limited (NSE:TALBROAUTO) Shares 26% But It Can Do More
Those holding Talbros Automotive Components Limited (NSE:TALBROAUTO) shares would be relieved that the share price has rebounded 26% in the last thirty days, but it needs to keep going to repair the recent damage it has caused to investor portfolios. The last month tops off a massive increase of 222% in the last year.
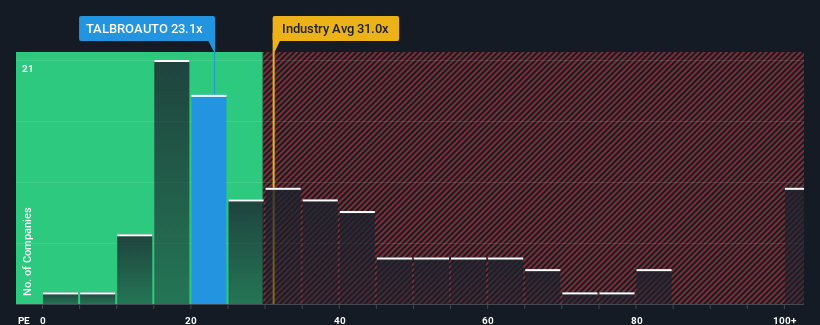
In spite of the firm bounce in price, Talbros Automotive Components' price-to-earnings (or "P/E") ratio of 23.1x might still make it look like a buy right now compared to the market in India, where around half of the companies have P/E ratios above 32x and even P/E's above 58x are quite common. Nonetheless, we'd need to dig a little deeper to determine if there is a rational basis for the reduced P/E.
Recent times have been quite advantageous for Talbros Automotive Components as its earnings have been rising very briskly. It might be that many expect the strong earnings performance to degrade substantially, which has repressed the P/E. If you like the company, you'd be hoping this isn't the case so that you could potentially pick up some stock while it's out of favour.
Check out our latest analysis for Talbros Automotive Components
How Is Talbros Automotive Components' Growth Trending?
Talbros Automotive Components' P/E ratio would be typical for a company that's only expected to deliver limited growth, and importantly, perform worse than the market.
Retrospectively, the last year delivered an exceptional 50% gain to the company's bottom line. The latest three year period has also seen an excellent 544% overall rise in EPS, aided by its short-term performance. Accordingly, shareholders would have probably welcomed those medium-term rates of earnings growth.
Comparing that to the market, which is only predicted to deliver 24% growth in the next 12 months, the company's momentum is stronger based on recent medium-term annualised earnings results.
In light of this, it's peculiar that Talbros Automotive Components' P/E sits below the majority of other companies. Apparently some shareholders believe the recent performance has exceeded its limits and have been accepting significantly lower selling prices.
The Bottom Line On Talbros Automotive Components' P/E
The latest share price surge wasn't enough to lift Talbros Automotive Components' P/E close to the market median. Using the price-to-earnings ratio alone to determine if you should sell your stock isn't sensible, however it can be a practical guide to the company's future prospects.
Our examination of Talbros Automotive Components revealed its three-year earnings trends aren't contributing to its P/E anywhere near as much as we would have predicted, given they look better than current market expectations. When we see strong earnings with faster-than-market growth, we assume potential risks are what might be placing significant pressure on the P/E ratio. At least price risks look to be very low if recent medium-term earnings trends continue, but investors seem to think future earnings could see a lot of volatility.
A lot of potential risks can sit within a company's balance sheet. Take a look at our free balance sheet analysis for Talbros Automotive Components with six simple checks on some of these key factors.
Of course, you might also be able to find a better stock than Talbros Automotive Components. So you may wish to see this free collection of other companies that have reasonable P/E ratios and have grown earnings strongly.
Valuation is complex, but we're helping make it simple.
Find out whether Talbros Automotive Components is potentially over or undervalued by checking out our comprehensive analysis, which includes fair value estimates, risks and warnings, dividends, insider transactions and financial health.
View the Free AnalysisHave feedback on this article? Concerned about the content? Get in touch with us directly. Alternatively, email editorial-team (at) simplywallst.com.
This article by Simply Wall St is general in nature. We provide commentary based on historical data and analyst forecasts only using an unbiased methodology and our articles are not intended to be financial advice. It does not constitute a recommendation to buy or sell any stock, and does not take account of your objectives, or your financial situation. We aim to bring you long-term focused analysis driven by fundamental data. Note that our analysis may not factor in the latest price-sensitive company announcements or qualitative material. Simply Wall St has no position in any stocks mentioned.

Simply Wall St
About NSEI:TALBROAUTO
Talbros Automotive Components
Talbros Automotive Components Limited engages in the manufacture and sale of auto components in India.
Flawless balance sheet with solid track record.
