Stock Analysis
The Market Lifts Precot Limited (NSE:PRECOT) Shares 28% But It Can Do More


Precot Limited (NSE:PRECOT) shareholders would be excited to see that the share price has had a great month, posting a 28% gain and recovering from prior weakness. The last 30 days bring the annual gain to a very sharp 97%.
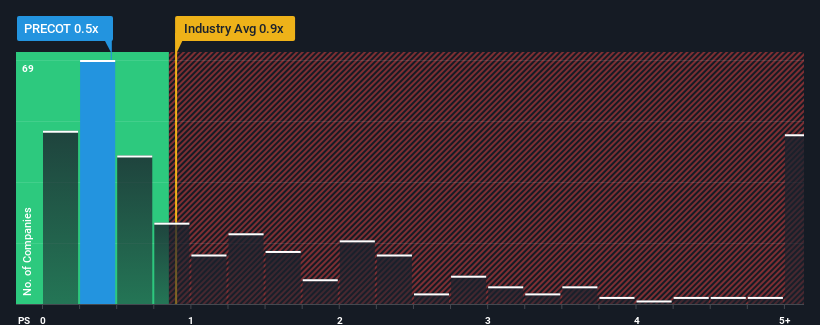
Although its price has surged higher, it's still not a stretch to say that Precot's price-to-sales (or "P/S") ratio of 0.5x right now seems quite "middle-of-the-road" compared to the Luxury industry in India, where the median P/S ratio is around 0.9x. While this might not raise any eyebrows, if the P/S ratio is not justified investors could be missing out on a potential opportunity or ignoring looming disappointment.
Check out our latest analysis for Precot
What Does Precot's P/S Mean For Shareholders?
For instance, Precot's receding revenue in recent times would have to be some food for thought. It might be that many expect the company to put the disappointing revenue performance behind them over the coming period, which has kept the P/S from falling. If you like the company, you'd at least be hoping this is the case so that you could potentially pick up some stock while it's not quite in favour.
Want the full picture on earnings, revenue and cash flow for the company? Then our free report on Precot will help you shine a light on its historical performance.How Is Precot's Revenue Growth Trending?
Precot's P/S ratio would be typical for a company that's only expected to deliver moderate growth, and importantly, perform in line with the industry.
Retrospectively, the last year delivered a frustrating 4.5% decrease to the company's top line. Still, the latest three year period has seen an excellent 52% overall rise in revenue, in spite of its unsatisfying short-term performance. Accordingly, while they would have preferred to keep the run going, shareholders would definitely welcome the medium-term rates of revenue growth.
Comparing that recent medium-term revenue trajectory with the industry's one-year growth forecast of 12% shows it's noticeably more attractive.
With this information, we find it interesting that Precot is trading at a fairly similar P/S compared to the industry. It may be that most investors are not convinced the company can maintain its recent growth rates.
What Does Precot's P/S Mean For Investors?
Precot appears to be back in favour with a solid price jump bringing its P/S back in line with other companies in the industry Generally, our preference is to limit the use of the price-to-sales ratio to establishing what the market thinks about the overall health of a company.
We didn't quite envision Precot's P/S sitting in line with the wider industry, considering the revenue growth over the last three-year is higher than the current industry outlook. It'd be fair to assume that potential risks the company faces could be the contributing factor to the lower than expected P/S. At least the risk of a price drop looks to be subdued if recent medium-term revenue trends continue, but investors seem to think future revenue could see some volatility.
You should always think about risks. Case in point, we've spotted 2 warning signs for Precot you should be aware of, and 1 of them is significant.
Of course, profitable companies with a history of great earnings growth are generally safer bets. So you may wish to see this free collection of other companies that have reasonable P/E ratios and have grown earnings strongly.
Valuation is complex, but we're helping make it simple.
Find out whether Precot is potentially over or undervalued by checking out our comprehensive analysis, which includes fair value estimates, risks and warnings, dividends, insider transactions and financial health.
View the Free AnalysisHave feedback on this article? Concerned about the content? Get in touch with us directly. Alternatively, email editorial-team (at) simplywallst.com.
This article by Simply Wall St is general in nature. We provide commentary based on historical data and analyst forecasts only using an unbiased methodology and our articles are not intended to be financial advice. It does not constitute a recommendation to buy or sell any stock, and does not take account of your objectives, or your financial situation. We aim to bring you long-term focused analysis driven by fundamental data. Note that our analysis may not factor in the latest price-sensitive company announcements or qualitative material. Simply Wall St has no position in any stocks mentioned.
About NSEI:PRECOT
Precot
Precot Limited engages in the manufacture and sale of yarn and technical textile products in India.
Good value with adequate balance sheet.
