Stock Analysis
- India
- /
- Auto Components
- /
- NSEI:JKTYRE
JK Tyre & Industries' (NSE:JKTYRE) 39% CAGR outpaced the company's earnings growth over the same five-year period

It hasn't been the best quarter for JK Tyre & Industries Limited (NSE:JKTYRE) shareholders, since the share price has fallen 20% in that time. But over five years returns have been remarkably great. Indeed, the share price is up a whopping 391% in that time. Arguably, the recent fall is to be expected after such a strong rise. Of course what matters most is whether the business can improve itself sustainably, thus justifying a higher price.
Since the stock has added ₹4.6b to its market cap in the past week alone, let's see if underlying performance has been driving long-term returns.
View our latest analysis for JK Tyre & Industries
To quote Buffett, 'Ships will sail around the world but the Flat Earth Society will flourish. There will continue to be wide discrepancies between price and value in the marketplace...' One flawed but reasonable way to assess how sentiment around a company has changed is to compare the earnings per share (EPS) with the share price.
Over half a decade, JK Tyre & Industries managed to grow its earnings per share at 17% a year. This EPS growth is slower than the share price growth of 37% per year, over the same period. This suggests that market participants hold the company in higher regard, these days. And that's hardly shocking given the track record of growth.
The graphic below depicts how EPS has changed over time (unveil the exact values by clicking on the image).
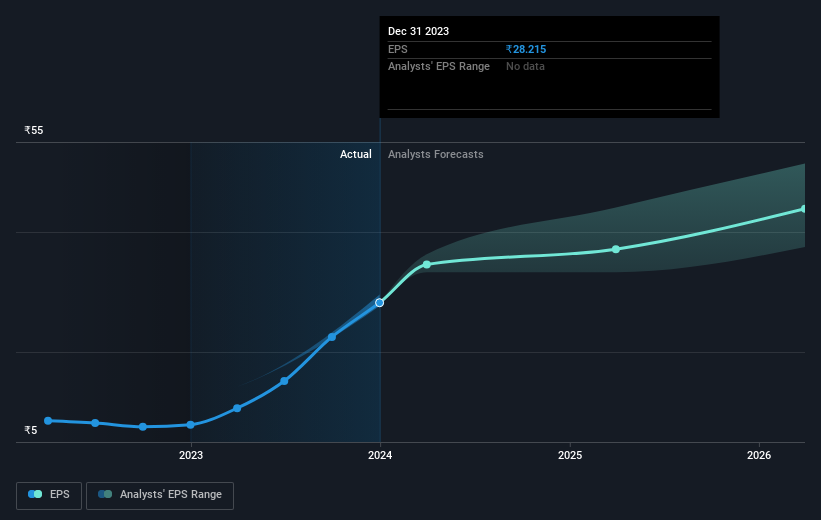
It is of course excellent to see how JK Tyre & Industries has grown profits over the years, but the future is more important for shareholders. This free interactive report on JK Tyre & Industries' balance sheet strength is a great place to start, if you want to investigate the stock further.
What About Dividends?
It is important to consider the total shareholder return, as well as the share price return, for any given stock. The TSR incorporates the value of any spin-offs or discounted capital raisings, along with any dividends, based on the assumption that the dividends are reinvested. So for companies that pay a generous dividend, the TSR is often a lot higher than the share price return. As it happens, JK Tyre & Industries' TSR for the last 5 years was 428%, which exceeds the share price return mentioned earlier. And there's no prize for guessing that the dividend payments largely explain the divergence!
A Different Perspective
We're pleased to report that JK Tyre & Industries shareholders have received a total shareholder return of 135% over one year. Of course, that includes the dividend. That gain is better than the annual TSR over five years, which is 39%. Therefore it seems like sentiment around the company has been positive lately. Someone with an optimistic perspective could view the recent improvement in TSR as indicating that the business itself is getting better with time. It's always interesting to track share price performance over the longer term. But to understand JK Tyre & Industries better, we need to consider many other factors. Case in point: We've spotted 3 warning signs for JK Tyre & Industries you should be aware of.
If you like to buy stocks alongside management, then you might just love this free list of companies. (Hint: insiders have been buying them).
Please note, the market returns quoted in this article reflect the market weighted average returns of stocks that currently trade on Indian exchanges.
Valuation is complex, but we're helping make it simple.
Find out whether JK Tyre & Industries is potentially over or undervalued by checking out our comprehensive analysis, which includes fair value estimates, risks and warnings, dividends, insider transactions and financial health.
View the Free AnalysisHave feedback on this article? Concerned about the content? Get in touch with us directly. Alternatively, email editorial-team (at) simplywallst.com.
This article by Simply Wall St is general in nature. We provide commentary based on historical data and analyst forecasts only using an unbiased methodology and our articles are not intended to be financial advice. It does not constitute a recommendation to buy or sell any stock, and does not take account of your objectives, or your financial situation. We aim to bring you long-term focused analysis driven by fundamental data. Note that our analysis may not factor in the latest price-sensitive company announcements or qualitative material. Simply Wall St has no position in any stocks mentioned.
About NSEI:JKTYRE
JK Tyre & Industries
Develops, manufactures, markets, and distributes automotive tyres, tubes, flaps, and retreads in India, Mexico, and internationally.
Solid track record with excellent balance sheet and pays a dividend.

