Stock Analysis
- South Africa
- /
- Capital Markets
- /
- JSE:PPE
The 11% return this week takes Purple Group's (JSE:PPE) shareholders five-year gains to 155%


When you buy a stock there is always a possibility that it could drop 100%. But when you pick a company that is really flourishing, you can make more than 100%. For instance, the price of Purple Group Limited (JSE:PPE) stock is up an impressive 150% over the last five years. It's also up 15% in about a month.
Since it's been a strong week for Purple Group shareholders, let's have a look at trend of the longer term fundamentals.
View our latest analysis for Purple Group
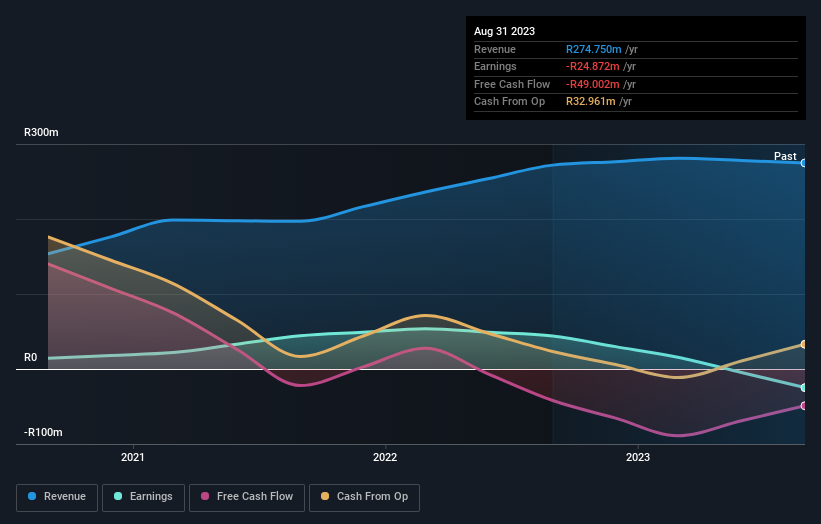
Given that Purple Group didn't make a profit in the last twelve months, we'll focus on revenue growth to form a quick view of its business development. Generally speaking, companies without profits are expected to grow revenue every year, and at a good clip. That's because fast revenue growth can be easily extrapolated to forecast profits, often of considerable size.
For the last half decade, Purple Group can boast revenue growth at a rate of 29% per year. That's well above most pre-profit companies. Meanwhile, its share price performance certainly reflects the strong growth, given the share price grew at 20% per year, compound, during the period. So it seems likely that buyers have paid attention to the strong revenue growth. Purple Group seems like a high growth stock - so growth investors might want to add it to their watchlist.
The image below shows how earnings and revenue have tracked over time (if you click on the image you can see greater detail).
We like that insiders have been buying shares in the last twelve months. Even so, future earnings will be far more important to whether current shareholders make money. It might be well worthwhile taking a look at our free report on Purple Group's earnings, revenue and cash flow.
What About The Total Shareholder Return (TSR)?
We'd be remiss not to mention the difference between Purple Group's total shareholder return (TSR) and its share price return. The TSR is a return calculation that accounts for the value of cash dividends (assuming that any dividend received was reinvested) and the calculated value of any discounted capital raisings and spin-offs. Dividends have been really beneficial for Purple Group shareholders, and that cash payout contributed to why its TSR of 155%, over the last 5 years, is better than the share price return.
A Different Perspective
Purple Group shareholders are down 45% for the year, but the market itself is up 1.8%. Even the share prices of good stocks drop sometimes, but we want to see improvements in the fundamental metrics of a business, before getting too interested. On the bright side, long term shareholders have made money, with a gain of 21% per year over half a decade. It could be that the recent sell-off is an opportunity, so it may be worth checking the fundamental data for signs of a long term growth trend. It's always interesting to track share price performance over the longer term. But to understand Purple Group better, we need to consider many other factors. Take risks, for example - Purple Group has 3 warning signs (and 1 which makes us a bit uncomfortable) we think you should know about.
If you like to buy stocks alongside management, then you might just love this free list of companies. (Hint: insiders have been buying them).
Please note, the market returns quoted in this article reflect the market weighted average returns of stocks that currently trade on South African exchanges.
Valuation is complex, but we're helping make it simple.
Find out whether Purple Group is potentially over or undervalued by checking out our comprehensive analysis, which includes fair value estimates, risks and warnings, dividends, insider transactions and financial health.
View the Free AnalysisHave feedback on this article? Concerned about the content? Get in touch with us directly. Alternatively, email editorial-team (at) simplywallst.com.
This article by Simply Wall St is general in nature. We provide commentary based on historical data and analyst forecasts only using an unbiased methodology and our articles are not intended to be financial advice. It does not constitute a recommendation to buy or sell any stock, and does not take account of your objectives, or your financial situation. We aim to bring you long-term focused analysis driven by fundamental data. Note that our analysis may not factor in the latest price-sensitive company announcements or qualitative material. Simply Wall St has no position in any stocks mentioned.
About JSE:PPE
Purple Group
Purple Group Limited, a financial services and technology company, engages in trading platforms, fractional property and crypto asset investing, retirement fund administration, and asset management businesses in South Africa.
Adequate balance sheet with weak fundamentals.
