Stock Analysis
Technogym (BIT:TGYM) stock falls 3.2% in past week as five-year earnings and shareholder returns continue downward trend


For many, the main point of investing is to generate higher returns than the overall market. But the main game is to find enough winners to more than offset the losers So we wouldn't blame long term Technogym S.p.A. (BIT:TGYM) shareholders for doubting their decision to hold, with the stock down 23% over a half decade. More recently, the share price has dropped a further 10% in a month. Importantly, this could be a market reaction to the recently released financial results. You can check out the latest numbers in our company report.
Since Technogym has shed €56m from its value in the past 7 days, let's see if the longer term decline has been driven by the business' economics.
Check out our latest analysis for Technogym
While the efficient markets hypothesis continues to be taught by some, it has been proven that markets are over-reactive dynamic systems, and investors are not always rational. By comparing earnings per share (EPS) and share price changes over time, we can get a feel for how investor attitudes to a company have morphed over time.
Looking back five years, both Technogym's share price and EPS declined; the latter at a rate of 4.4% per year. Notably, the share price has fallen at 5% per year, fairly close to the change in the EPS. This suggests that market participants have not changed their view of the company all that much. So it's fair to say the share price has been responding to changes in EPS.
The graphic below depicts how EPS has changed over time (unveil the exact values by clicking on the image).
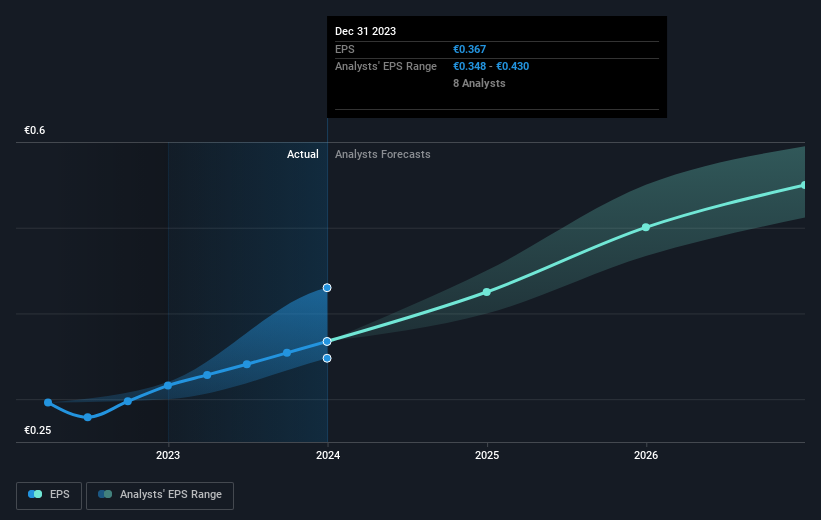
We know that Technogym has improved its bottom line lately, but is it going to grow revenue? You could check out this free report showing analyst revenue forecasts.
What About Dividends?
As well as measuring the share price return, investors should also consider the total shareholder return (TSR). The TSR incorporates the value of any spin-offs or discounted capital raisings, along with any dividends, based on the assumption that the dividends are reinvested. So for companies that pay a generous dividend, the TSR is often a lot higher than the share price return. In the case of Technogym, it has a TSR of -15% for the last 5 years. That exceeds its share price return that we previously mentioned. This is largely a result of its dividend payments!
A Different Perspective
Technogym shareholders are up 5.0% for the year (even including dividends). But that return falls short of the market. But at least that's still a gain! Over five years the TSR has been a reduction of 3% per year, over five years. So this might be a sign the business has turned its fortunes around. It's always interesting to track share price performance over the longer term. But to understand Technogym better, we need to consider many other factors. For example, we've discovered 1 warning sign for Technogym that you should be aware of before investing here.
If you like to buy stocks alongside management, then you might just love this free list of companies. (Hint: insiders have been buying them).
Please note, the market returns quoted in this article reflect the market weighted average returns of stocks that currently trade on Italian exchanges.
Valuation is complex, but we're helping make it simple.
Find out whether Technogym is potentially over or undervalued by checking out our comprehensive analysis, which includes fair value estimates, risks and warnings, dividends, insider transactions and financial health.
View the Free AnalysisHave feedback on this article? Concerned about the content? Get in touch with us directly. Alternatively, email editorial-team (at) simplywallst.com.
This article by Simply Wall St is general in nature. We provide commentary based on historical data and analyst forecasts only using an unbiased methodology and our articles are not intended to be financial advice. It does not constitute a recommendation to buy or sell any stock, and does not take account of your objectives, or your financial situation. We aim to bring you long-term focused analysis driven by fundamental data. Note that our analysis may not factor in the latest price-sensitive company announcements or qualitative material. Simply Wall St has no position in any stocks mentioned.
About BIT:TGYM
Technogym
Technogym S.p.A., a wellness company, designs, manufactures, and sells fitness equipment worldwide.
Flawless balance sheet with solid track record.
