Stock Analysis
- Sweden
- /
- Metals and Mining
- /
- OM:SSAB A
SSAB's (STO:SSAB A) five-year total shareholder returns outpace the underlying earnings growth
It might be of some concern to shareholders to see the SSAB AB (publ) (STO:SSAB A) share price down 11% in the last month. On the other hand the returns over the last half decade have not been bad. It's good to see the share price is up 81% in that time, better than its market return of 69%.
While the stock has fallen 6.5% this week, it's worth focusing on the longer term and seeing if the stocks historical returns have been driven by the underlying fundamentals.
See our latest analysis for SSAB
While markets are a powerful pricing mechanism, share prices reflect investor sentiment, not just underlying business performance. One flawed but reasonable way to assess how sentiment around a company has changed is to compare the earnings per share (EPS) with the share price.
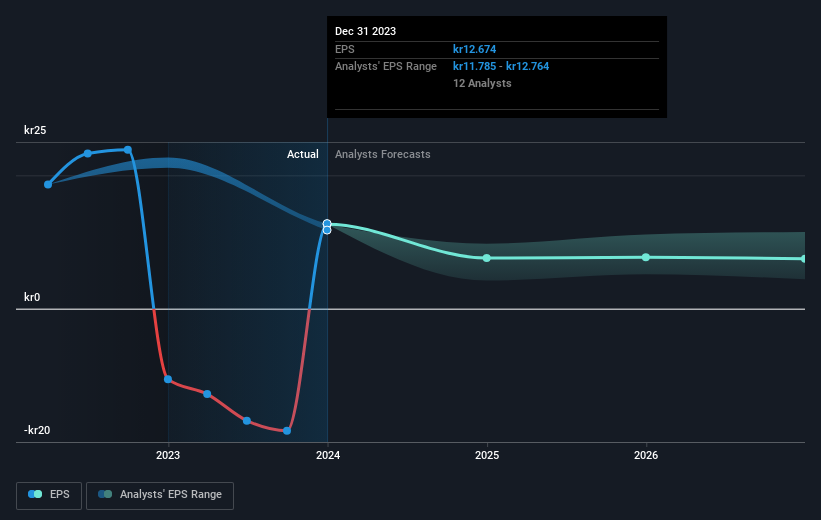
During the five years of share price growth, SSAB moved from a loss to profitability. That's generally thought to be a genuine positive, so investors may expect to see an increasing share price.
You can see how EPS has changed over time in the image below (click on the chart to see the exact values).
We know that SSAB has improved its bottom line lately, but is it going to grow revenue? You could check out this free report showing analyst revenue forecasts.
What About Dividends?
When looking at investment returns, it is important to consider the difference between total shareholder return (TSR) and share price return. The TSR incorporates the value of any spin-offs or discounted capital raisings, along with any dividends, based on the assumption that the dividends are reinvested. Arguably, the TSR gives a more comprehensive picture of the return generated by a stock. In the case of SSAB, it has a TSR of 122% for the last 5 years. That exceeds its share price return that we previously mentioned. The dividends paid by the company have thusly boosted the total shareholder return.
A Different Perspective
Investors in SSAB had a tough year, with a total loss of 4.1% (including dividends), against a market gain of about 13%. However, keep in mind that even the best stocks will sometimes underperform the market over a twelve month period. On the bright side, long term shareholders have made money, with a gain of 17% per year over half a decade. If the fundamental data continues to indicate long term sustainable growth, the current sell-off could be an opportunity worth considering. While it is well worth considering the different impacts that market conditions can have on the share price, there are other factors that are even more important. Like risks, for instance. Every company has them, and we've spotted 2 warning signs for SSAB (of which 1 makes us a bit uncomfortable!) you should know about.
We will like SSAB better if we see some big insider buys. While we wait, check out this free list of growing companies with considerable, recent, insider buying.
Please note, the market returns quoted in this article reflect the market weighted average returns of stocks that currently trade on Swedish exchanges.
Valuation is complex, but we're helping make it simple.
Find out whether SSAB is potentially over or undervalued by checking out our comprehensive analysis, which includes fair value estimates, risks and warnings, dividends, insider transactions and financial health.
View the Free AnalysisHave feedback on this article? Concerned about the content? Get in touch with us directly. Alternatively, email editorial-team (at) simplywallst.com.
This article by Simply Wall St is general in nature. We provide commentary based on historical data and analyst forecasts only using an unbiased methodology and our articles are not intended to be financial advice. It does not constitute a recommendation to buy or sell any stock, and does not take account of your objectives, or your financial situation. We aim to bring you long-term focused analysis driven by fundamental data. Note that our analysis may not factor in the latest price-sensitive company announcements or qualitative material. Simply Wall St has no position in any stocks mentioned.

Simply Wall St
About OM:SSAB A
SSAB
SSAB AB (publ) produces and sells steel products in Sweden, Finland, Rest of Europe, the United States, and internationally.
Flawless balance sheet average dividend payer.
