Stock Analysis
- Spain
- /
- Entertainment
- /
- BME:SQRL
Squirrel Media (BME:SQRL) investors are sitting on a loss of 62% if they invested five years ago

Statistically speaking, long term investing is a profitable endeavour. But no-one is immune from buying too high. To wit, the Squirrel Media, S.A. (BME:SQRL) share price managed to fall 85% over five long years. We certainly feel for shareholders who bought near the top. And some of the more recent buyers are probably worried, too, with the stock falling 32% in the last year. Even worse, it's down 11% in about a month, which isn't fun at all. We really hope anyone holding through that price crash has a diversified portfolio. Even when you lose money, you don't have to lose the lesson.
It's worthwhile assessing if the company's economics have been moving in lockstep with these underwhelming shareholder returns, or if there is some disparity between the two. So let's do just that.
See our latest analysis for Squirrel Media
While the efficient markets hypothesis continues to be taught by some, it has been proven that markets are over-reactive dynamic systems, and investors are not always rational. By comparing earnings per share (EPS) and share price changes over time, we can get a feel for how investor attitudes to a company have morphed over time.
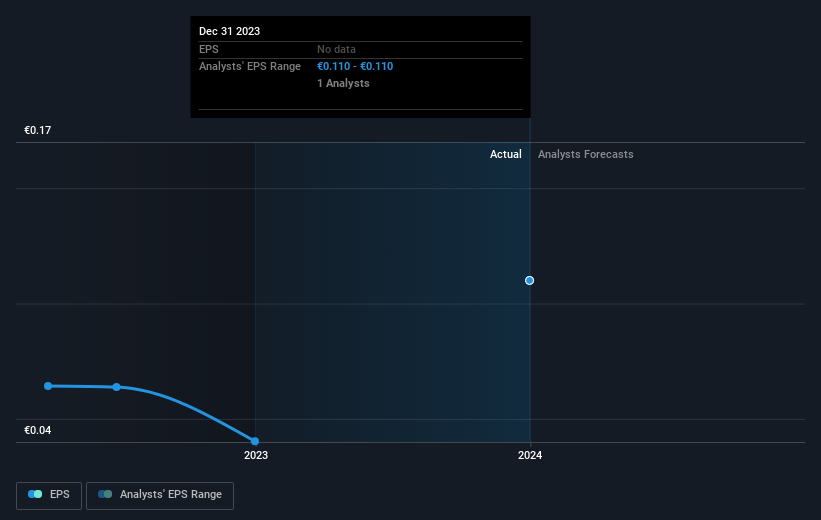
During the five years over which the share price declined, Squirrel Media's earnings per share (EPS) dropped by 12% each year. Readers should note that the share price has fallen faster than the EPS, at a rate of 32% per year, over the period. This implies that the market was previously too optimistic about the stock. The low P/E ratio of 9.68 further reflects this reticence.
You can see how EPS has changed over time in the image below (click on the chart to see the exact values).
It is of course excellent to see how Squirrel Media has grown profits over the years, but the future is more important for shareholders. It might be well worthwhile taking a look at our free report on how its financial position has changed over time.
What About The Total Shareholder Return (TSR)?
Investors should note that there's a difference between Squirrel Media's total shareholder return (TSR) and its share price change, which we've covered above. The TSR is a return calculation that accounts for the value of cash dividends (assuming that any dividend received was reinvested) and the calculated value of any discounted capital raisings and spin-offs. We note that Squirrel Media's TSR, at -62% is higher than its share price return of -85%. When you consider it hasn't been paying a dividend, this data suggests shareholders have benefitted from a spin-off, or had the opportunity to acquire attractively priced shares in a discounted capital raising.
A Different Perspective
Investors in Squirrel Media had a tough year, with a total loss of 32%, against a market gain of about 17%. However, keep in mind that even the best stocks will sometimes underperform the market over a twelve month period. Regrettably, last year's performance caps off a bad run, with the shareholders facing a total loss of 10% per year over five years. Generally speaking long term share price weakness can be a bad sign, though contrarian investors might want to research the stock in hope of a turnaround. I find it very interesting to look at share price over the long term as a proxy for business performance. But to truly gain insight, we need to consider other information, too. Even so, be aware that Squirrel Media is showing 1 warning sign in our investment analysis , you should know about...
If you are like me, then you will not want to miss this free list of growing companies that insiders are buying.
Please note, the market returns quoted in this article reflect the market weighted average returns of stocks that currently trade on Spanish exchanges.
Valuation is complex, but we're helping make it simple.
Find out whether Squirrel Media is potentially over or undervalued by checking out our comprehensive analysis, which includes fair value estimates, risks and warnings, dividends, insider transactions and financial health.
View the Free AnalysisHave feedback on this article? Concerned about the content? Get in touch with us directly. Alternatively, email editorial-team (at) simplywallst.com.
This article by Simply Wall St is general in nature. We provide commentary based on historical data and analyst forecasts only using an unbiased methodology and our articles are not intended to be financial advice. It does not constitute a recommendation to buy or sell any stock, and does not take account of your objectives, or your financial situation. We aim to bring you long-term focused analysis driven by fundamental data. Note that our analysis may not factor in the latest price-sensitive company announcements or qualitative material. Simply Wall St has no position in any stocks mentioned.

Simply Wall St
About BME:SQRL
Squirrel Media
Squirrel Media, S.A. produces and distributes audiovisual contents in Spain and internationally.
Outstanding track record and undervalued.
