Stock Analysis
Dongfeng Motor Group Company Limited (HKG:489) shareholders won't be pleased to see that the share price has had a very rough month, dropping 25% and undoing the prior period's positive performance. The drop over the last 30 days has capped off a tough year for shareholders, with the share price down 24% in that time.
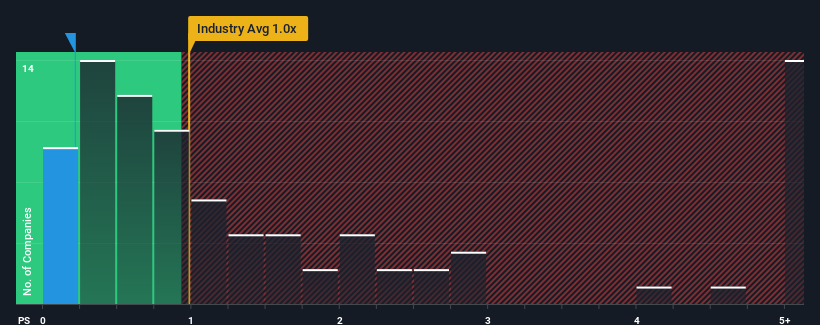
Although its price has dipped substantially, it's still not a stretch to say that Dongfeng Motor Group's price-to-sales (or "P/S") ratio of 0.2x right now seems quite "middle-of-the-road" compared to the Auto industry in Hong Kong, where the median P/S ratio is around 0.5x. However, investors might be overlooking a clear opportunity or potential setback if there is no rational basis for the P/S.
View our latest analysis for Dongfeng Motor Group
What Does Dongfeng Motor Group's Recent Performance Look Like?
Recent times haven't been great for Dongfeng Motor Group as its revenue has been rising slower than most other companies. It might be that many expect the uninspiring revenue performance to strengthen positively, which has kept the P/S ratio from falling. However, if this isn't the case, investors might get caught out paying too much for the stock.
If you'd like to see what analysts are forecasting going forward, you should check out our free report on Dongfeng Motor Group.What Are Revenue Growth Metrics Telling Us About The P/S?
In order to justify its P/S ratio, Dongfeng Motor Group would need to produce growth that's similar to the industry.
Retrospectively, the last year delivered a decent 7.2% gain to the company's revenues. Ultimately though, it couldn't turn around the poor performance of the prior period, with revenue shrinking 8.4% in total over the last three years. Accordingly, shareholders would have felt downbeat about the medium-term rates of revenue growth.
Looking ahead now, revenue is anticipated to climb by 0.8% per annum during the coming three years according to the eight analysts following the company. With the industry predicted to deliver 19% growth each year, the company is positioned for a weaker revenue result.
With this information, we find it interesting that Dongfeng Motor Group is trading at a fairly similar P/S compared to the industry. Apparently many investors in the company are less bearish than analysts indicate and aren't willing to let go of their stock right now. These shareholders may be setting themselves up for future disappointment if the P/S falls to levels more in line with the growth outlook.
What Does Dongfeng Motor Group's P/S Mean For Investors?
Following Dongfeng Motor Group's share price tumble, its P/S is just clinging on to the industry median P/S. Typically, we'd caution against reading too much into price-to-sales ratios when settling on investment decisions, though it can reveal plenty about what other market participants think about the company.
Our look at the analysts forecasts of Dongfeng Motor Group's revenue prospects has shown that its inferior revenue outlook isn't negatively impacting its P/S as much as we would have predicted. At present, we aren't confident in the P/S as the predicted future revenues aren't likely to support a more positive sentiment for long. A positive change is needed in order to justify the current price-to-sales ratio.
A lot of potential risks can sit within a company's balance sheet. Take a look at our free balance sheet analysis for Dongfeng Motor Group with six simple checks on some of these key factors.
If these risks are making you reconsider your opinion on Dongfeng Motor Group, explore our interactive list of high quality stocks to get an idea of what else is out there.
Valuation is complex, but we're helping make it simple.
Find out whether Dongfeng Motor Group is potentially over or undervalued by checking out our comprehensive analysis, which includes fair value estimates, risks and warnings, dividends, insider transactions and financial health.
View the Free AnalysisHave feedback on this article? Concerned about the content? Get in touch with us directly. Alternatively, email editorial-team (at) simplywallst.com.
This article by Simply Wall St is general in nature. We provide commentary based on historical data and analyst forecasts only using an unbiased methodology and our articles are not intended to be financial advice. It does not constitute a recommendation to buy or sell any stock, and does not take account of your objectives, or your financial situation. We aim to bring you long-term focused analysis driven by fundamental data. Note that our analysis may not factor in the latest price-sensitive company announcements or qualitative material. Simply Wall St has no position in any stocks mentioned.

Simply Wall St
About SEHK:489
Dongfeng Motor Group
Dongfeng Motor Group Company Limited engages in the manufacture and sale of commercial, passenger, military, and energy, as well as key automotive components and parts in the People’s Republic of China.
Fair value with moderate growth potential.
