Stock Analysis
- Singapore
- /
- Entertainment
- /
- SGX:1B0
mm2 Asia (SGX:1B0 investor five-year losses grow to 89% as the stock sheds S$13m this past week

Long term investing works well, but it doesn't always work for each individual stock. It hits us in the gut when we see fellow investors suffer a loss. Anyone who held mm2 Asia Ltd. (SGX:1B0) for five years would be nursing their metaphorical wounds since the share price dropped 93% in that time. We also note that the stock has performed poorly over the last year, with the share price down 49%. We really hope anyone holding through that price crash has a diversified portfolio. Even when you lose money, you don't have to lose the lesson.
With the stock having lost 13% in the past week, it's worth taking a look at business performance and seeing if there's any red flags.
View our latest analysis for mm2 Asia
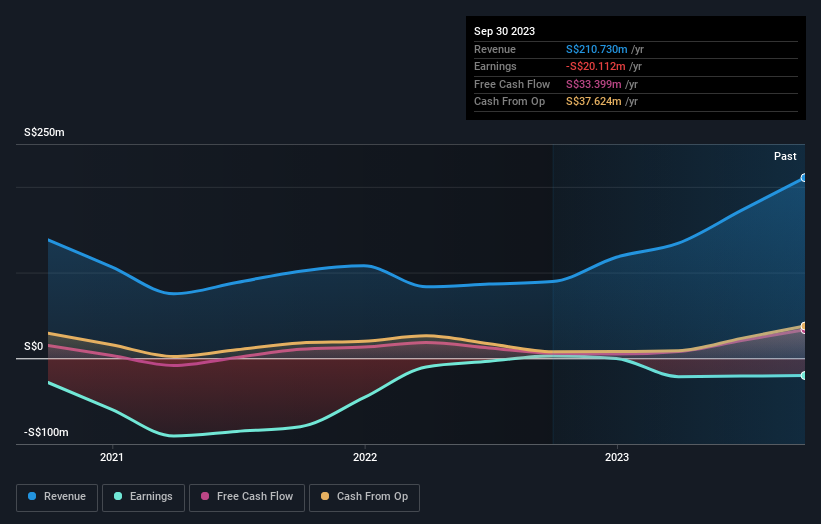
Given that mm2 Asia didn't make a profit in the last twelve months, we'll focus on revenue growth to form a quick view of its business development. When a company doesn't make profits, we'd generally hope to see good revenue growth. As you can imagine, fast revenue growth, when maintained, often leads to fast profit growth.
Over half a decade mm2 Asia reduced its trailing twelve month revenue by 19% for each year. That's definitely a weaker result than most pre-profit companies report. So it's not altogether surprising to see the share price down 14% per year in the same time period. We don't think this is a particularly promising picture. Of course, the poor performance could mean the market has been too severe selling down. That can happen.
You can see how earnings and revenue have changed over time in the image below (click on the chart to see the exact values).
Take a more thorough look at mm2 Asia's financial health with this free report on its balance sheet.
What About The Total Shareholder Return (TSR)?
We've already covered mm2 Asia's share price action, but we should also mention its total shareholder return (TSR). Arguably the TSR is a more complete return calculation because it accounts for the value of dividends (as if they were reinvested), along with the hypothetical value of any discounted capital that have been offered to shareholders. We note that mm2 Asia's TSR, at -89% is higher than its share price return of -93%. When you consider it hasn't been paying a dividend, this data suggests shareholders have benefitted from a spin-off, or had the opportunity to acquire attractively priced shares in a discounted capital raising.
A Different Perspective
We regret to report that mm2 Asia shareholders are down 42% for the year. Unfortunately, that's worse than the broader market decline of 3.5%. Having said that, it's inevitable that some stocks will be oversold in a falling market. The key is to keep your eyes on the fundamental developments. Unfortunately, last year's performance may indicate unresolved challenges, given that it was worse than the annualised loss of 14% over the last half decade. Generally speaking long term share price weakness can be a bad sign, though contrarian investors might want to research the stock in hope of a turnaround. I find it very interesting to look at share price over the long term as a proxy for business performance. But to truly gain insight, we need to consider other information, too. Case in point: We've spotted 4 warning signs for mm2 Asia you should be aware of, and 1 of them is a bit unpleasant.
If you would prefer to check out another company -- one with potentially superior financials -- then do not miss this free list of companies that have proven they can grow earnings.
Please note, the market returns quoted in this article reflect the market weighted average returns of stocks that currently trade on Singaporean exchanges.
Valuation is complex, but we're helping make it simple.
Find out whether mm2 Asia is potentially over or undervalued by checking out our comprehensive analysis, which includes fair value estimates, risks and warnings, dividends, insider transactions and financial health.
View the Free AnalysisHave feedback on this article? Concerned about the content? Get in touch with us directly. Alternatively, email editorial-team (at) simplywallst.com.
This article by Simply Wall St is general in nature. We provide commentary based on historical data and analyst forecasts only using an unbiased methodology and our articles are not intended to be financial advice. It does not constitute a recommendation to buy or sell any stock, and does not take account of your objectives, or your financial situation. We aim to bring you long-term focused analysis driven by fundamental data. Note that our analysis may not factor in the latest price-sensitive company announcements or qualitative material. Simply Wall St has no position in any stocks mentioned.

Simply Wall St
About SGX:1B0
mm2 Asia
mm2 Asia Ltd. produces, distributes, and sponsors films, television (TV), and online content in Singapore, Malaysia, Hong Kong, Taiwan, China, and internationally.
Good value with adequate balance sheet.
