Stock Analysis
- United Arab Emirates
- /
- Food and Staples Retail
- /
- DFM:UNIONCOOP
Is Union Coop's (DFM:UNIONCOOP) Stock On A Downtrend As A Result Of Its Poor Financials?

Union Coop (DFM:UNIONCOOP) has had a rough week with its share price down 7.1%. To decide if this trend could continue, we decided to look at its weak fundamentals as they shape the long-term market trends. Particularly, we will be paying attention to Union Coop's ROE today.
Return on equity or ROE is a key measure used to assess how efficiently a company's management is utilizing the company's capital. Put another way, it reveals the company's success at turning shareholder investments into profits.
View our latest analysis for Union Coop
How To Calculate Return On Equity?
The formula for return on equity is:
Return on Equity = Net Profit (from continuing operations) ÷ Shareholders' Equity
So, based on the above formula, the ROE for Union Coop is:
12% = د.إ297m ÷ د.إ2.6b (Based on the trailing twelve months to December 2023).
The 'return' is the profit over the last twelve months. That means that for every AED1 worth of shareholders' equity, the company generated AED0.12 in profit.
Why Is ROE Important For Earnings Growth?
We have already established that ROE serves as an efficient profit-generating gauge for a company's future earnings. Based on how much of its profits the company chooses to reinvest or "retain", we are then able to evaluate a company's future ability to generate profits. Assuming all else is equal, companies that have both a higher return on equity and higher profit retention are usually the ones that have a higher growth rate when compared to companies that don't have the same features.
Union Coop's Earnings Growth And 12% ROE
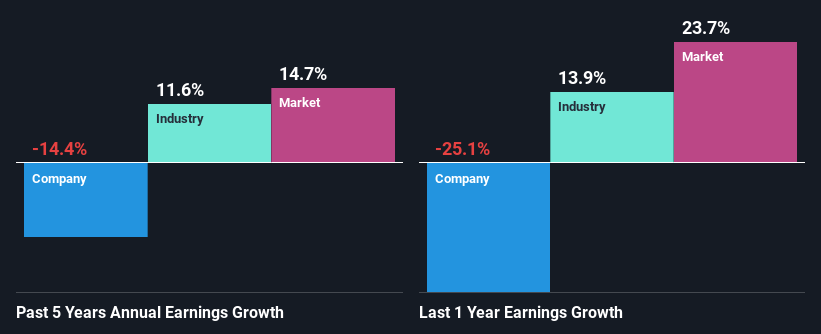
As you can see, Union Coop's ROE looks pretty weak. Still, the company's ROE is higher than the average industry ROE of 9.1% so that's certainly interesting. But then again, seeing that Union Coop's five year net income shrunk at a rate of 14% in the past five years, makes us think again. Remember, the company's ROE is quite low to begin with, just that it is higher than the industry average. Therefore, the decline in earnings could also be the result of this.
So, as a next step, we compared Union Coop's performance against the industry and were disappointed to discover that while the company has been shrinking its earnings, the industry has been growing its earnings at a rate of 12% over the last few years.
The basis for attaching value to a company is, to a great extent, tied to its earnings growth. It’s important for an investor to know whether the market has priced in the company's expected earnings growth (or decline). Doing so will help them establish if the stock's future looks promising or ominous. If you're wondering about Union Coop's's valuation, check out this gauge of its price-to-earnings ratio, as compared to its industry.
Is Union Coop Making Efficient Use Of Its Profits?
Union Coop's high three-year median payout ratio of 105% suggests that the company is depleting its resources to keep up its dividend payments, and this shows in its shrinking earnings. Paying a dividend beyond their means is usually not viable over the long term. You can see the 3 risks we have identified for Union Coop by visiting our risks dashboard for free on our platform here.
In addition, Union Coop only recently started paying a dividend so the management probably decided the shareholders prefer dividends even though earnings have been shrinking.
Conclusion
Overall, we would be extremely cautious before making any decision on Union Coop. Its earnings growth particularly is not much to talk about even though it does have a pretty respectable ROE. The lack of growth can be blamed on its poor earnings retention. As discussed earlier, the company is retaining hardly any of its profits. Until now, we have only just grazed the surface of the company's past performance by looking at the company's fundamentals. To gain further insights into Union Coop's past profit growth, check out this visualization of past earnings, revenue and cash flows.
Valuation is complex, but we're helping make it simple.
Find out whether Union Coop is potentially over or undervalued by checking out our comprehensive analysis, which includes fair value estimates, risks and warnings, dividends, insider transactions and financial health.
View the Free AnalysisHave feedback on this article? Concerned about the content? Get in touch with us directly. Alternatively, email editorial-team (at) simplywallst.com.
This article by Simply Wall St is general in nature. We provide commentary based on historical data and analyst forecasts only using an unbiased methodology and our articles are not intended to be financial advice. It does not constitute a recommendation to buy or sell any stock, and does not take account of your objectives, or your financial situation. We aim to bring you long-term focused analysis driven by fundamental data. Note that our analysis may not factor in the latest price-sensitive company announcements or qualitative material. Simply Wall St has no position in any stocks mentioned.

Simply Wall St
About DFM:UNIONCOOP
Union Coop
Union Coop establishes and manages hypermarkets and consumer cooperatives in the United Arab Emirates.
Flawless balance sheet unattractive dividend payer.
