Stock Analysis
- Taiwan
- /
- Real Estate
- /
- TWSE:2539
Is Sakura Development Co.,Ltd's (TWSE:2539) Stock's Recent Performance Being Led By Its Attractive Financial Prospects?

Most readers would already be aware that Sakura DevelopmentLtd's (TWSE:2539) stock increased significantly by 54% over the past three months. Given that the market rewards strong financials in the long-term, we wonder if that is the case in this instance. Specifically, we decided to study Sakura DevelopmentLtd's ROE in this article.
ROE or return on equity is a useful tool to assess how effectively a company can generate returns on the investment it received from its shareholders. In other words, it is a profitability ratio which measures the rate of return on the capital provided by the company's shareholders.
View our latest analysis for Sakura DevelopmentLtd
How Is ROE Calculated?
The formula for ROE is:
Return on Equity = Net Profit (from continuing operations) ÷ Shareholders' Equity
So, based on the above formula, the ROE for Sakura DevelopmentLtd is:
16% = NT$1.9b ÷ NT$12b (Based on the trailing twelve months to December 2023).
The 'return' refers to a company's earnings over the last year. So, this means that for every NT$1 of its shareholder's investments, the company generates a profit of NT$0.16.
What Has ROE Got To Do With Earnings Growth?
We have already established that ROE serves as an efficient profit-generating gauge for a company's future earnings. Based on how much of its profits the company chooses to reinvest or "retain", we are then able to evaluate a company's future ability to generate profits. Generally speaking, other things being equal, firms with a high return on equity and profit retention, have a higher growth rate than firms that don’t share these attributes.
Sakura DevelopmentLtd's Earnings Growth And 16% ROE
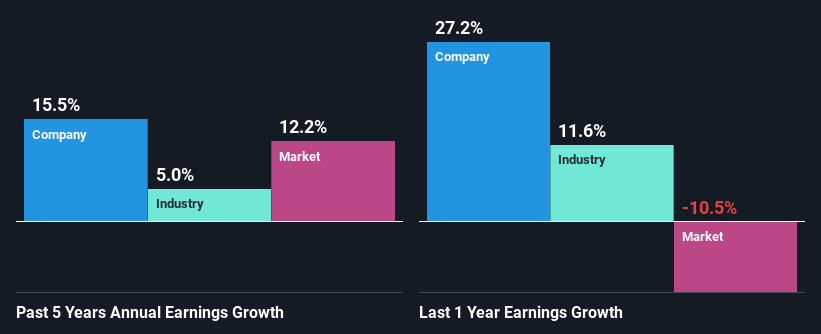
To begin with, Sakura DevelopmentLtd seems to have a respectable ROE. On comparing with the average industry ROE of 8.9% the company's ROE looks pretty remarkable. This certainly adds some context to Sakura DevelopmentLtd's decent 16% net income growth seen over the past five years.
As a next step, we compared Sakura DevelopmentLtd's net income growth with the industry, and pleasingly, we found that the growth seen by the company is higher than the average industry growth of 5.0%.
Earnings growth is a huge factor in stock valuation. The investor should try to establish if the expected growth or decline in earnings, whichever the case may be, is priced in. This then helps them determine if the stock is placed for a bright or bleak future. If you're wondering about Sakura DevelopmentLtd's's valuation, check out this gauge of its price-to-earnings ratio, as compared to its industry.
Is Sakura DevelopmentLtd Using Its Retained Earnings Effectively?
Sakura DevelopmentLtd has a low three-year median payout ratio of 14%, meaning that the company retains the remaining 86% of its profits. This suggests that the management is reinvesting most of the profits to grow the business.
Besides, Sakura DevelopmentLtd has been paying dividends for at least ten years or more. This shows that the company is committed to sharing profits with its shareholders.
Summary
On the whole, we feel that Sakura DevelopmentLtd's performance has been quite good. Particularly, we like that the company is reinvesting heavily into its business, and at a high rate of return. Unsurprisingly, this has led to an impressive earnings growth. If the company continues to grow its earnings the way it has, that could have a positive impact on its share price given how earnings per share influence long-term share prices. Let's not forget, business risk is also one of the factors that affects the price of the stock. So this is also an important area that investors need to pay attention to before making a decision on any business. Our risks dashboard will have the 1 risk we have identified for Sakura DevelopmentLtd.
Valuation is complex, but we're helping make it simple.
Find out whether Sakura DevelopmentLtd is potentially over or undervalued by checking out our comprehensive analysis, which includes fair value estimates, risks and warnings, dividends, insider transactions and financial health.
View the Free AnalysisHave feedback on this article? Concerned about the content? Get in touch with us directly. Alternatively, email editorial-team (at) simplywallst.com.
This article by Simply Wall St is general in nature. We provide commentary based on historical data and analyst forecasts only using an unbiased methodology and our articles are not intended to be financial advice. It does not constitute a recommendation to buy or sell any stock, and does not take account of your objectives, or your financial situation. We aim to bring you long-term focused analysis driven by fundamental data. Note that our analysis may not factor in the latest price-sensitive company announcements or qualitative material. Simply Wall St has no position in any stocks mentioned.

Simply Wall St
About TWSE:2539
Sakura DevelopmentLtd
Sakura Development Co.,Ltd engages in the sale and lease of residential properties with focus on the Zhongzhangtou area in Taiwan.
Solid track record with adequate balance sheet.
