Stock Analysis

Key Insights
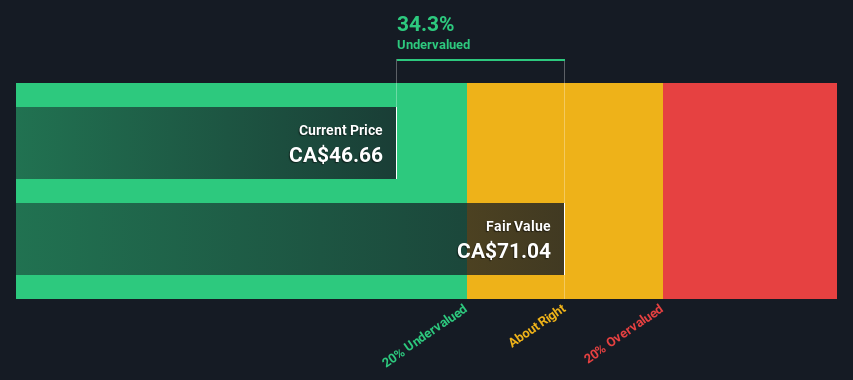
- Exchange Income's estimated fair value is CA$71.04 based on 2 Stage Free Cash Flow to Equity
- Exchange Income's CA$46.66 share price signals that it might be 34% undervalued
- Analyst price target for EIF is CA$63.95 which is 10.0% below our fair value estimate
How far off is Exchange Income Corporation (TSE:EIF) from its intrinsic value? Using the most recent financial data, we'll take a look at whether the stock is fairly priced by taking the expected future cash flows and discounting them to their present value. This will be done using the Discounted Cash Flow (DCF) model. There's really not all that much to it, even though it might appear quite complex.
Remember though, that there are many ways to estimate a company's value, and a DCF is just one method. For those who are keen learners of equity analysis, the Simply Wall St analysis model here may be something of interest to you.
Check out our latest analysis for Exchange Income
The Calculation
We are going to use a two-stage DCF model, which, as the name states, takes into account two stages of growth. The first stage is generally a higher growth period which levels off heading towards the terminal value, captured in the second 'steady growth' period. To start off with, we need to estimate the next ten years of cash flows. Where possible we use analyst estimates, but when these aren't available we extrapolate the previous free cash flow (FCF) from the last estimate or reported value. We assume companies with shrinking free cash flow will slow their rate of shrinkage, and that companies with growing free cash flow will see their growth rate slow, over this period. We do this to reflect that growth tends to slow more in the early years than it does in later years.
A DCF is all about the idea that a dollar in the future is less valuable than a dollar today, so we need to discount the sum of these future cash flows to arrive at a present value estimate:
10-year free cash flow (FCF) estimate
| 2024 | 2025 | 2026 | 2027 | 2028 | 2029 | 2030 | 2031 | 2032 | 2033 | |
| Levered FCF (CA$, Millions) | CA$215.4m | CA$214.4m | CA$215.0m | CA$216.7m | CA$219.2m | CA$222.3m | CA$225.8m | CA$229.7m | CA$233.8m | CA$238.1m |
| Growth Rate Estimate Source | Analyst x3 | Analyst x4 | Est @ 0.29% | Est @ 0.80% | Est @ 1.16% | Est @ 1.41% | Est @ 1.58% | Est @ 1.70% | Est @ 1.79% | Est @ 1.85% |
| Present Value (CA$, Millions) Discounted @ 8.0% | CA$199 | CA$184 | CA$171 | CA$159 | CA$149 | CA$140 | CA$132 | CA$124 | CA$117 | CA$110 |
("Est" = FCF growth rate estimated by Simply Wall St)
Present Value of 10-year Cash Flow (PVCF) = CA$1.5b
The second stage is also known as Terminal Value, this is the business's cash flow after the first stage. For a number of reasons a very conservative growth rate is used that cannot exceed that of a country's GDP growth. In this case we have used the 5-year average of the 10-year government bond yield (2.0%) to estimate future growth. In the same way as with the 10-year 'growth' period, we discount future cash flows to today's value, using a cost of equity of 8.0%.
Terminal Value (TV)= FCF2033 × (1 + g) ÷ (r – g) = CA$238m× (1 + 2.0%) ÷ (8.0%– 2.0%) = CA$4.0b
Present Value of Terminal Value (PVTV)= TV / (1 + r)10= CA$4.0b÷ ( 1 + 8.0%)10= CA$1.9b
The total value, or equity value, is then the sum of the present value of the future cash flows, which in this case is CA$3.4b. The last step is to then divide the equity value by the number of shares outstanding. Relative to the current share price of CA$46.7, the company appears quite undervalued at a 34% discount to where the stock price trades currently. Valuations are imprecise instruments though, rather like a telescope - move a few degrees and end up in a different galaxy. Do keep this in mind.
The Assumptions
The calculation above is very dependent on two assumptions. The first is the discount rate and the other is the cash flows. Part of investing is coming up with your own evaluation of a company's future performance, so try the calculation yourself and check your own assumptions. The DCF also does not consider the possible cyclicality of an industry, or a company's future capital requirements, so it does not give a full picture of a company's potential performance. Given that we are looking at Exchange Income as potential shareholders, the cost of equity is used as the discount rate, rather than the cost of capital (or weighted average cost of capital, WACC) which accounts for debt. In this calculation we've used 8.0%, which is based on a levered beta of 1.306. Beta is a measure of a stock's volatility, compared to the market as a whole. We get our beta from the industry average beta of globally comparable companies, with an imposed limit between 0.8 and 2.0, which is a reasonable range for a stable business.
SWOT Analysis for Exchange Income
- No major strengths identified for EIF.
- Earnings growth over the past year underperformed the Airlines industry.
- Interest payments on debt are not well covered.
- Dividend is low compared to the top 25% of dividend payers in the Airlines market.
- Shareholders have been diluted in the past year.
- Annual earnings are forecast to grow faster than the Canadian market.
- Trading below our estimate of fair value by more than 20%.
- Debt is not well covered by operating cash flow.
- Dividends are not covered by earnings.
- Revenue is forecast to grow slower than 20% per year.
Looking Ahead:
Valuation is only one side of the coin in terms of building your investment thesis, and it shouldn't be the only metric you look at when researching a company. The DCF model is not a perfect stock valuation tool. Instead the best use for a DCF model is to test certain assumptions and theories to see if they would lead to the company being undervalued or overvalued. For example, changes in the company's cost of equity or the risk free rate can significantly impact the valuation. Why is the intrinsic value higher than the current share price? For Exchange Income, we've put together three pertinent elements you should assess:
- Risks: Consider for instance, the ever-present spectre of investment risk. We've identified 3 warning signs with Exchange Income (at least 2 which are a bit concerning) , and understanding these should be part of your investment process.
- Future Earnings: How does EIF's growth rate compare to its peers and the wider market? Dig deeper into the analyst consensus number for the upcoming years by interacting with our free analyst growth expectation chart.
- Other Solid Businesses: Low debt, high returns on equity and good past performance are fundamental to a strong business. Why not explore our interactive list of stocks with solid business fundamentals to see if there are other companies you may not have considered!
PS. The Simply Wall St app conducts a discounted cash flow valuation for every stock on the TSX every day. If you want to find the calculation for other stocks just search here.
Valuation is complex, but we're helping make it simple.
Find out whether Exchange Income is potentially over or undervalued by checking out our comprehensive analysis, which includes fair value estimates, risks and warnings, dividends, insider transactions and financial health.
View the Free AnalysisHave feedback on this article? Concerned about the content? Get in touch with us directly. Alternatively, email editorial-team (at) simplywallst.com.
This article by Simply Wall St is general in nature. We provide commentary based on historical data and analyst forecasts only using an unbiased methodology and our articles are not intended to be financial advice. It does not constitute a recommendation to buy or sell any stock, and does not take account of your objectives, or your financial situation. We aim to bring you long-term focused analysis driven by fundamental data. Note that our analysis may not factor in the latest price-sensitive company announcements or qualitative material. Simply Wall St has no position in any stocks mentioned.

Simply Wall St
About TSX:EIF
Exchange Income
Exchange Income Corporation, together with its subsidiaries, engages in aerospace and aviation services and equipment, and manufacturing businesses worldwide.
Good value with moderate growth potential.
