Stock Analysis
- United States
- /
- Aerospace & Defense
- /
- NYSE:NOC
Investors in Northrop Grumman (NYSE:NOC) have seen respectable returns of 76% over the past five years


When you buy and hold a stock for the long term, you definitely want it to provide a positive return. But more than that, you probably want to see it rise more than the market average. But Northrop Grumman Corporation (NYSE:NOC) has fallen short of that second goal, with a share price rise of 62% over five years, which is below the market return. Zooming in, the stock is actually down 3.5% in the last year.
So let's assess the underlying fundamentals over the last 5 years and see if they've moved in lock-step with shareholder returns.
See our latest analysis for Northrop Grumman
In his essay The Superinvestors of Graham-and-Doddsville Warren Buffett described how share prices do not always rationally reflect the value of a business. One way to examine how market sentiment has changed over time is to look at the interaction between a company's share price and its earnings per share (EPS).
During five years of share price growth, Northrop Grumman actually saw its EPS drop 5.7% per year.
This means it's unlikely the market is judging the company based on earnings growth. Since the change in EPS doesn't seem to correlate with the change in share price, it's worth taking a look at other metrics.
The modest 1.6% dividend yield is unlikely to be propping up the share price. On the other hand, Northrop Grumman's revenue is growing nicely, at a compound rate of 3.6% over the last five years. In that case, the company may be sacrificing current earnings per share to drive growth.
The image below shows how earnings and revenue have tracked over time (if you click on the image you can see greater detail).
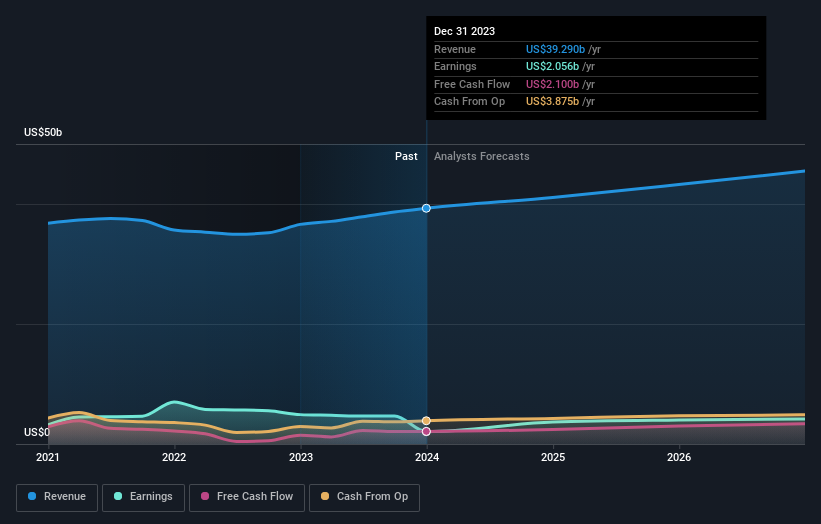
Northrop Grumman is well known by investors, and plenty of clever analysts have tried to predict the future profit levels. You can see what analysts are predicting for Northrop Grumman in this interactive graph of future profit estimates.
What About Dividends?
When looking at investment returns, it is important to consider the difference between total shareholder return (TSR) and share price return. Whereas the share price return only reflects the change in the share price, the TSR includes the value of dividends (assuming they were reinvested) and the benefit of any discounted capital raising or spin-off. Arguably, the TSR gives a more comprehensive picture of the return generated by a stock. In the case of Northrop Grumman, it has a TSR of 76% for the last 5 years. That exceeds its share price return that we previously mentioned. This is largely a result of its dividend payments!
A Different Perspective
Investors in Northrop Grumman had a tough year, with a total loss of 1.9% (including dividends), against a market gain of about 25%. Even the share prices of good stocks drop sometimes, but we want to see improvements in the fundamental metrics of a business, before getting too interested. On the bright side, long term shareholders have made money, with a gain of 12% per year over half a decade. If the fundamental data continues to indicate long term sustainable growth, the current sell-off could be an opportunity worth considering. While it is well worth considering the different impacts that market conditions can have on the share price, there are other factors that are even more important. Even so, be aware that Northrop Grumman is showing 3 warning signs in our investment analysis , you should know about...
Of course, you might find a fantastic investment by looking elsewhere. So take a peek at this free list of companies we expect will grow earnings.
Please note, the market returns quoted in this article reflect the market weighted average returns of stocks that currently trade on American exchanges.
Valuation is complex, but we're helping make it simple.
Find out whether Northrop Grumman is potentially over or undervalued by checking out our comprehensive analysis, which includes fair value estimates, risks and warnings, dividends, insider transactions and financial health.
View the Free AnalysisHave feedback on this article? Concerned about the content? Get in touch with us directly. Alternatively, email editorial-team (at) simplywallst.com.
This article by Simply Wall St is general in nature. We provide commentary based on historical data and analyst forecasts only using an unbiased methodology and our articles are not intended to be financial advice. It does not constitute a recommendation to buy or sell any stock, and does not take account of your objectives, or your financial situation. We aim to bring you long-term focused analysis driven by fundamental data. Note that our analysis may not factor in the latest price-sensitive company announcements or qualitative material. Simply Wall St has no position in any stocks mentioned.
About NYSE:NOC
Northrop Grumman
Northrop Grumman Corporation operates as an aerospace and defense technology company in the United States, Asia/Pacific, Europe, and internationally.
Established dividend payer with adequate balance sheet.
