Stock Analysis
- India
- /
- Gas Utilities
- /
- NSEI:GAIL
Investors in GAIL (India) (NSE:GAIL) have seen impressive returns of 164% over the past three years


The worst result, after buying shares in a company (assuming no leverage), would be if you lose all the money you put in. But if you buy shares in a really great company, you can more than double your money. For example, the GAIL (India) Limited (NSE:GAIL) share price has soared 130% in the last three years. That sort of return is as solid as granite. It's also good to see the share price up 26% over the last quarter.
So let's investigate and see if the longer term performance of the company has been in line with the underlying business' progress.
View our latest analysis for GAIL (India)
In his essay The Superinvestors of Graham-and-Doddsville Warren Buffett described how share prices do not always rationally reflect the value of a business. One flawed but reasonable way to assess how sentiment around a company has changed is to compare the earnings per share (EPS) with the share price.
During the three years of share price growth, GAIL (India) actually saw its earnings per share (EPS) drop 0.3% per year.
Based on these numbers, we think that the decline in earnings per share may not be a good representation of how the business has changed over the years. Therefore, it makes sense to look into other metrics.
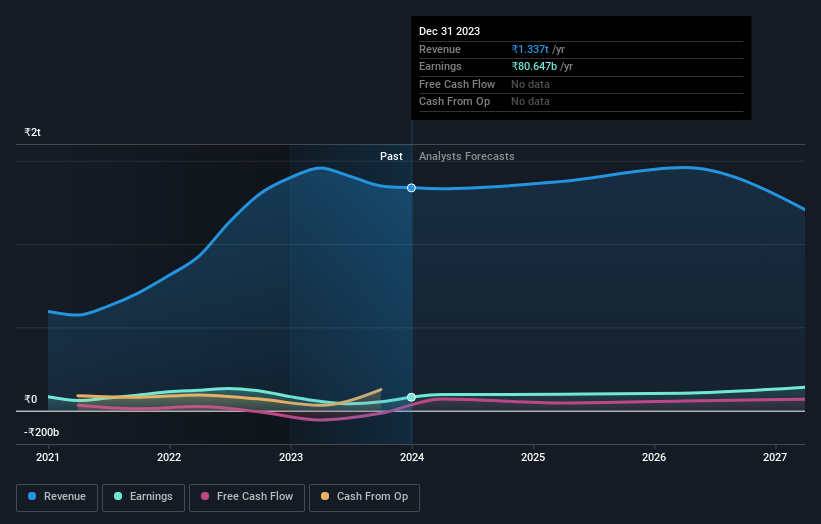
It could be that the revenue growth of 32% per year is viewed as evidence that GAIL (India) is growing. If the company is being managed for the long term good, today's shareholders might be right to hold on.
You can see how earnings and revenue have changed over time in the image below (click on the chart to see the exact values).
It's probably worth noting that the CEO is paid less than the median at similar sized companies. But while CEO remuneration is always worth checking, the really important question is whether the company can grow earnings going forward. So it makes a lot of sense to check out what analysts think GAIL (India) will earn in the future (free profit forecasts).
What About Dividends?
When looking at investment returns, it is important to consider the difference between total shareholder return (TSR) and share price return. Whereas the share price return only reflects the change in the share price, the TSR includes the value of dividends (assuming they were reinvested) and the benefit of any discounted capital raising or spin-off. It's fair to say that the TSR gives a more complete picture for stocks that pay a dividend. As it happens, GAIL (India)'s TSR for the last 3 years was 164%, which exceeds the share price return mentioned earlier. The dividends paid by the company have thusly boosted the total shareholder return.
A Different Perspective
It's nice to see that GAIL (India) shareholders have received a total shareholder return of 96% over the last year. Of course, that includes the dividend. Since the one-year TSR is better than the five-year TSR (the latter coming in at 18% per year), it would seem that the stock's performance has improved in recent times. Given the share price momentum remains strong, it might be worth taking a closer look at the stock, lest you miss an opportunity. It's always interesting to track share price performance over the longer term. But to understand GAIL (India) better, we need to consider many other factors. For instance, we've identified 1 warning sign for GAIL (India) that you should be aware of.
If you are like me, then you will not want to miss this free list of growing companies that insiders are buying.
Please note, the market returns quoted in this article reflect the market weighted average returns of stocks that currently trade on Indian exchanges.
Valuation is complex, but we're helping make it simple.
Find out whether GAIL (India) is potentially over or undervalued by checking out our comprehensive analysis, which includes fair value estimates, risks and warnings, dividends, insider transactions and financial health.
View the Free AnalysisHave feedback on this article? Concerned about the content? Get in touch with us directly. Alternatively, email editorial-team (at) simplywallst.com.
This article by Simply Wall St is general in nature. We provide commentary based on historical data and analyst forecasts only using an unbiased methodology and our articles are not intended to be financial advice. It does not constitute a recommendation to buy or sell any stock, and does not take account of your objectives, or your financial situation. We aim to bring you long-term focused analysis driven by fundamental data. Note that our analysis may not factor in the latest price-sensitive company announcements or qualitative material. Simply Wall St has no position in any stocks mentioned.
About NSEI:GAIL
GAIL (India)
GAIL (India) Limited operates as a natural gas processing and distribution company in India and internationally.
Average dividend payer with mediocre balance sheet.
