Stock Analysis
- South Africa
- /
- Building
- /
- JSE:TRL
Investors Appear Satisfied With Trellidor Holdings Limited's (JSE:TRL) Prospects As Shares Rocket 26%

Those holding Trellidor Holdings Limited (JSE:TRL) shares would be relieved that the share price has rebounded 26% in the last thirty days, but it needs to keep going to repair the recent damage it has caused to investor portfolios. Not all shareholders will be feeling jubilant, since the share price is still down a very disappointing 40% in the last twelve months.
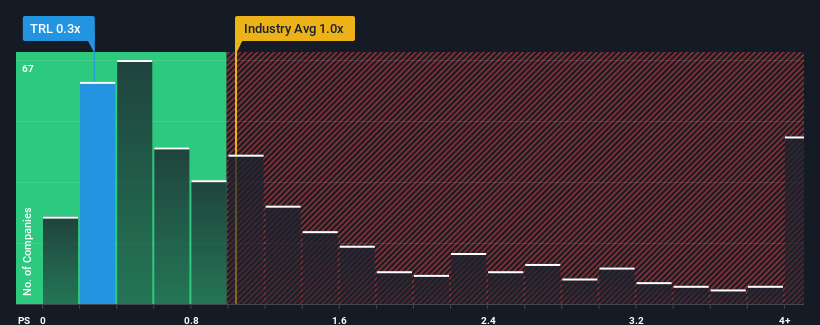
Although its price has surged higher, there still wouldn't be many who think Trellidor Holdings' price-to-sales (or "P/S") ratio of 0.3x is worth a mention when the median P/S in South Africa's Building industry is similar at about 0.4x. While this might not raise any eyebrows, if the P/S ratio is not justified investors could be missing out on a potential opportunity or ignoring looming disappointment.
See our latest analysis for Trellidor Holdings
What Does Trellidor Holdings' Recent Performance Look Like?
Trellidor Holdings has been doing a decent job lately as it's been growing revenue at a reasonable pace. Perhaps the expectation moving forward is that the revenue growth will track in line with the wider industry for the near term, which has kept the P/S subdued. If not, then at least existing shareholders probably aren't too pessimistic about the future direction of the share price.
Want the full picture on earnings, revenue and cash flow for the company? Then our free report on Trellidor Holdings will help you shine a light on its historical performance.What Are Revenue Growth Metrics Telling Us About The P/S?
Trellidor Holdings' P/S ratio would be typical for a company that's only expected to deliver moderate growth, and importantly, perform in line with the industry.
Retrospectively, the last year delivered a decent 3.6% gain to the company's revenues. The latest three year period has also seen a 22% overall rise in revenue, aided somewhat by its short-term performance. Accordingly, shareholders would have probably been satisfied with the medium-term rates of revenue growth.
Weighing that recent medium-term revenue trajectory against the broader industry's one-year forecast for expansion of 6.4% shows it's about the same on an annualised basis.
In light of this, it's understandable that Trellidor Holdings' P/S sits in line with the majority of other companies. Apparently shareholders are comfortable to simply hold on assuming the company will continue keeping a low profile.
What Does Trellidor Holdings' P/S Mean For Investors?
Trellidor Holdings' stock has a lot of momentum behind it lately, which has brought its P/S level with the rest of the industry. Typically, we'd caution against reading too much into price-to-sales ratios when settling on investment decisions, though it can reveal plenty about what other market participants think about the company.
It appears to us that Trellidor Holdings maintains its moderate P/S off the back of its recent three-year growth being in line with the wider industry forecast. With previous revenue trends that keep up with the current industry outlook, it's hard to justify the company's P/S ratio deviating much from it's current point. Given the current circumstances, it seems improbable that the share price will experience any significant movement in either direction in the near future if recent medium-term revenue trends persist.
Before you take the next step, you should know about the 4 warning signs for Trellidor Holdings that we have uncovered.
If companies with solid past earnings growth is up your alley, you may wish to see this free collection of other companies with strong earnings growth and low P/E ratios.
Valuation is complex, but we're helping make it simple.
Find out whether Trellidor Holdings is potentially over or undervalued by checking out our comprehensive analysis, which includes fair value estimates, risks and warnings, dividends, insider transactions and financial health.
View the Free AnalysisHave feedback on this article? Concerned about the content? Get in touch with us directly. Alternatively, email editorial-team (at) simplywallst.com.
This article by Simply Wall St is general in nature. We provide commentary based on historical data and analyst forecasts only using an unbiased methodology and our articles are not intended to be financial advice. It does not constitute a recommendation to buy or sell any stock, and does not take account of your objectives, or your financial situation. We aim to bring you long-term focused analysis driven by fundamental data. Note that our analysis may not factor in the latest price-sensitive company announcements or qualitative material. Simply Wall St has no position in any stocks mentioned.
About JSE:TRL
Trellidor Holdings
Trellidor Holdings Limited, an investment holding company, manufactures and sells custom-made barrier security products primarily in South Africa, the United Kingdom, and Ghana.
Imperfect balance sheet and overvalued.
