Stock Analysis
- United Kingdom
- /
- Energy Services
- /
- LSE:HTG
Hunting (LON:HTG) delivers shareholders decent 53% return over 1 year, surging 9.7% in the last week alone

Passive investing in index funds can generate returns that roughly match the overall market. But you can significantly boost your returns by picking above-average stocks. To wit, the Hunting PLC (LON:HTG) share price is 47% higher than it was a year ago, much better than the market decline of around 0.3% (not including dividends) in the same period. That's a solid performance by our standards! It is also impressive that the stock is up 34% over three years, adding to the sense that it is a real winner.
On the back of a solid 7-day performance, let's check what role the company's fundamentals have played in driving long term shareholder returns.
View our latest analysis for Hunting
To quote Buffett, 'Ships will sail around the world but the Flat Earth Society will flourish. There will continue to be wide discrepancies between price and value in the marketplace...' By comparing earnings per share (EPS) and share price changes over time, we can get a feel for how investor attitudes to a company have morphed over time.
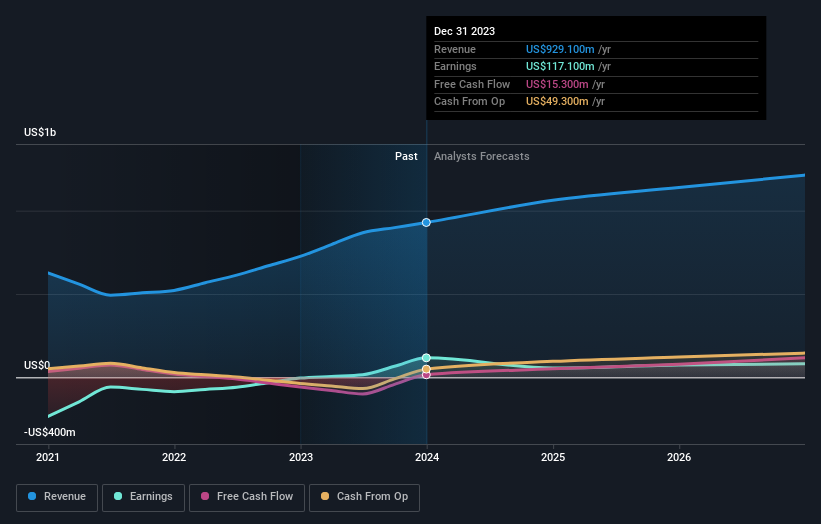
Hunting went from making a loss to reporting a profit, in the last year.
When a company is just on the edge of profitability it can be well worth considering other metrics in order to more precisely gauge growth (and therefore understand share price movements).
However the year on year revenue growth of 28% would help. We do see some companies suppress earnings in order to accelerate revenue growth.
The image below shows how earnings and revenue have tracked over time (if you click on the image you can see greater detail).
It is of course excellent to see how Hunting has grown profits over the years, but the future is more important for shareholders. Take a more thorough look at Hunting's financial health with this free report on its balance sheet.
What About Dividends?
When looking at investment returns, it is important to consider the difference between total shareholder return (TSR) and share price return. The TSR is a return calculation that accounts for the value of cash dividends (assuming that any dividend received was reinvested) and the calculated value of any discounted capital raisings and spin-offs. Arguably, the TSR gives a more comprehensive picture of the return generated by a stock. As it happens, Hunting's TSR for the last 1 year was 53%, which exceeds the share price return mentioned earlier. This is largely a result of its dividend payments!
A Different Perspective
We're pleased to report that Hunting shareholders have received a total shareholder return of 53% over one year. Of course, that includes the dividend. Notably the five-year annualised TSR loss of 6% per year compares very unfavourably with the recent share price performance. We generally put more weight on the long term performance over the short term, but the recent improvement could hint at a (positive) inflection point within the business. It's always interesting to track share price performance over the longer term. But to understand Hunting better, we need to consider many other factors. Even so, be aware that Hunting is showing 1 warning sign in our investment analysis , you should know about...
If you like to buy stocks alongside management, then you might just love this free list of companies. (Hint: insiders have been buying them).
Please note, the market returns quoted in this article reflect the market weighted average returns of stocks that currently trade on British exchanges.
Valuation is complex, but we're helping make it simple.
Find out whether Hunting is potentially over or undervalued by checking out our comprehensive analysis, which includes fair value estimates, risks and warnings, dividends, insider transactions and financial health.
View the Free AnalysisHave feedback on this article? Concerned about the content? Get in touch with us directly. Alternatively, email editorial-team (at) simplywallst.com.
This article by Simply Wall St is general in nature. We provide commentary based on historical data and analyst forecasts only using an unbiased methodology and our articles are not intended to be financial advice. It does not constitute a recommendation to buy or sell any stock, and does not take account of your objectives, or your financial situation. We aim to bring you long-term focused analysis driven by fundamental data. Note that our analysis may not factor in the latest price-sensitive company announcements or qualitative material. Simply Wall St has no position in any stocks mentioned.

Simply Wall St
About LSE:HTG
Hunting
Hunting PLC, together with its subsidiaries, manufactures components, technology systems, and precision parts worldwide.
Excellent balance sheet and good value.
