Stock Analysis
- United States
- /
- Aerospace & Defense
- /
- NYSE:TXT
Here's Why Shareholders May Want To Be Cautious With Increasing Textron Inc.'s (NYSE:TXT) CEO Pay Packet


Key Insights
- Textron to hold its Annual General Meeting on 24th of April
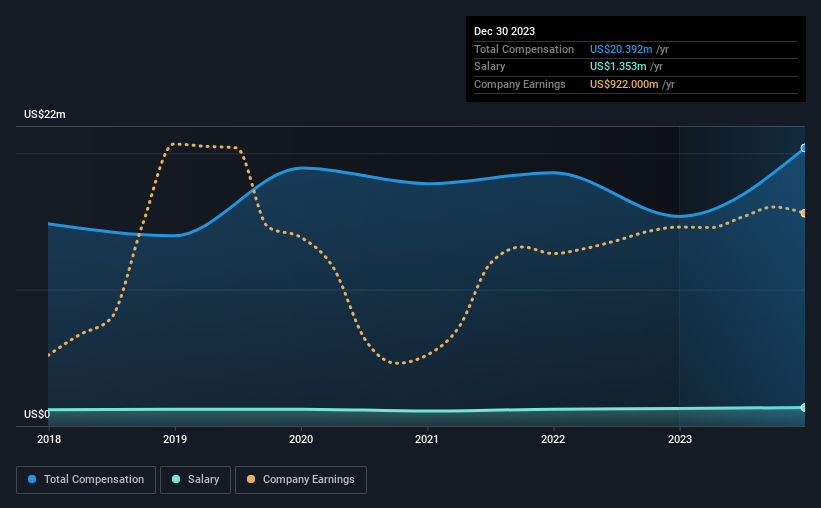
- CEO Scott Donnelly's total compensation includes salary of US$1.35m
- The overall pay is 35% above the industry average
- Over the past three years, Textron's EPS grew by 52% and over the past three years, the total shareholder return was 56%
Performance at Textron Inc. (NYSE:TXT) has been reasonably good and CEO Scott Donnelly has done a decent job of steering the company in the right direction. As shareholders go into the upcoming AGM on 24th of April, CEO compensation will probably not be their focus, but rather the steps management will take to continue the growth momentum. However, some shareholders will still be cautious of paying the CEO excessively.
Check out our latest analysis for Textron
How Does Total Compensation For Scott Donnelly Compare With Other Companies In The Industry?
According to our data, Textron Inc. has a market capitalization of US$18b, and paid its CEO total annual compensation worth US$20m over the year to December 2023. That's a notable increase of 33% on last year. While this analysis focuses on total compensation, it's worth acknowledging that the salary portion is lower, valued at US$1.4m.
For comparison, other companies in the American Aerospace & Defense industry with market capitalizations above US$8.0b, reported a median total CEO compensation of US$15m. Accordingly, our analysis reveals that Textron Inc. pays Scott Donnelly north of the industry median. What's more, Scott Donnelly holds US$50m worth of shares in the company in their own name, indicating that they have a lot of skin in the game.
| Component | 2023 | 2022 | Proportion (2023) |
| Salary | US$1.4m | US$1.3m | 7% |
| Other | US$19m | US$14m | 93% |
| Total Compensation | US$20m | US$15m | 100% |
Speaking on an industry level, nearly 22% of total compensation represents salary, while the remainder of 78% is other remuneration. It's interesting to note that Textron allocates a smaller portion of compensation to salary in comparison to the broader industry. It's important to note that a slant towards non-salary compensation suggests that total pay is tied to the company's performance.
Textron Inc.'s Growth
Over the past three years, Textron Inc. has seen its earnings per share (EPS) grow by 52% per year. It achieved revenue growth of 6.4% over the last year.
Shareholders would be glad to know that the company has improved itself over the last few years. It's also good to see modest revenue growth, suggesting the underlying business is healthy. Historical performance can sometimes be a good indicator on what's coming up next but if you want to peer into the company's future you might be interested in this free visualization of analyst forecasts.
Has Textron Inc. Been A Good Investment?
We think that the total shareholder return of 56%, over three years, would leave most Textron Inc. shareholders smiling. As a result, some may believe the CEO should be paid more than is normal for companies of similar size.
In Summary...
Seeing that the company has put up a decent performance, only a few shareholders, if any at all, might have questions about the CEO pay in the upcoming AGM. However, any decision to raise CEO pay might be met with some objections from the shareholders given that the CEO is already paid higher than the industry average.
Whatever your view on compensation, you might want to check if insiders are buying or selling Textron shares (free trial).
Arguably, business quality is much more important than CEO compensation levels. So check out this free list of interesting companies that have HIGH return on equity and low debt.
Valuation is complex, but we're helping make it simple.
Find out whether Textron is potentially over or undervalued by checking out our comprehensive analysis, which includes fair value estimates, risks and warnings, dividends, insider transactions and financial health.
View the Free AnalysisHave feedback on this article? Concerned about the content? Get in touch with us directly. Alternatively, email editorial-team (at) simplywallst.com.
This article by Simply Wall St is general in nature. We provide commentary based on historical data and analyst forecasts only using an unbiased methodology and our articles are not intended to be financial advice. It does not constitute a recommendation to buy or sell any stock, and does not take account of your objectives, or your financial situation. We aim to bring you long-term focused analysis driven by fundamental data. Note that our analysis may not factor in the latest price-sensitive company announcements or qualitative material. Simply Wall St has no position in any stocks mentioned.
About NYSE:TXT
Textron
Textron Inc. operates in the aircraft, defense, industrial, and finance businesses worldwide.
Flawless balance sheet and undervalued.
