Stock Analysis
- Netherlands
- /
- Chemicals
- /
- ENXTAM:OCI
Health Check: How Prudently Does OCI (AMS:OCI) Use Debt?

Howard Marks put it nicely when he said that, rather than worrying about share price volatility, 'The possibility of permanent loss is the risk I worry about... and every practical investor I know worries about.' So it seems the smart money knows that debt - which is usually involved in bankruptcies - is a very important factor, when you assess how risky a company is. Importantly, OCI N.V. (AMS:OCI) does carry debt. But the more important question is: how much risk is that debt creating?
Why Does Debt Bring Risk?
Debt and other liabilities become risky for a business when it cannot easily fulfill those obligations, either with free cash flow or by raising capital at an attractive price. In the worst case scenario, a company can go bankrupt if it cannot pay its creditors. While that is not too common, we often do see indebted companies permanently diluting shareholders because lenders force them to raise capital at a distressed price. By replacing dilution, though, debt can be an extremely good tool for businesses that need capital to invest in growth at high rates of return. When we think about a company's use of debt, we first look at cash and debt together.
See our latest analysis for OCI
What Is OCI's Debt?
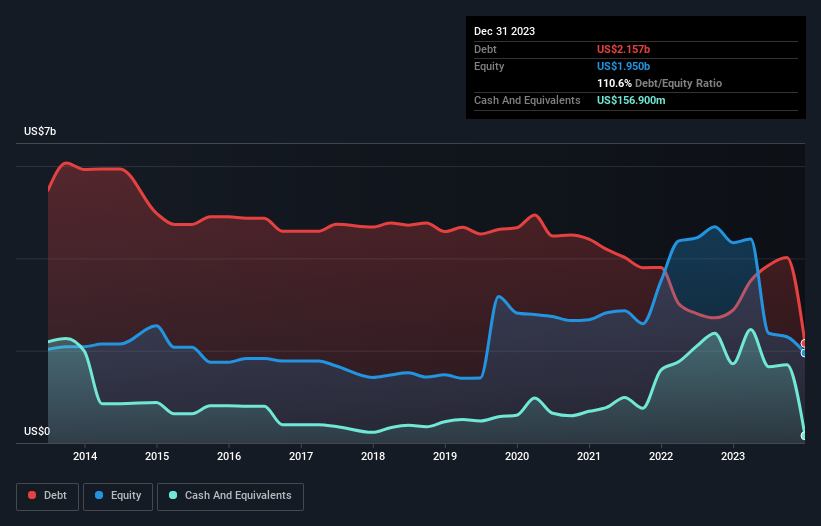
The image below, which you can click on for greater detail, shows that OCI had debt of US$2.16b at the end of December 2023, a reduction from US$2.88b over a year. On the flip side, it has US$156.9m in cash leading to net debt of about US$2.00b.
How Healthy Is OCI's Balance Sheet?
Zooming in on the latest balance sheet data, we can see that OCI had liabilities of US$4.76b due within 12 months and liabilities of US$2.27b due beyond that. On the other hand, it had cash of US$156.9m and US$366.1m worth of receivables due within a year. So its liabilities outweigh the sum of its cash and (near-term) receivables by US$6.50b.
Given this deficit is actually higher than the company's market capitalization of US$5.81b, we think shareholders really should watch OCI's debt levels, like a parent watching their child ride a bike for the first time. Hypothetically, extremely heavy dilution would be required if the company were forced to pay down its liabilities by raising capital at the current share price. The balance sheet is clearly the area to focus on when you are analysing debt. But it is future earnings, more than anything, that will determine OCI's ability to maintain a healthy balance sheet going forward. So if you want to see what the professionals think, you might find this free report on analyst profit forecasts to be interesting.
Over 12 months, OCI made a loss at the EBIT level, and saw its revenue drop to US$2.0b, which is a fall of 47%. To be frank that doesn't bode well.
Caveat Emptor
While OCI's falling revenue is about as heartwarming as a wet blanket, arguably its earnings before interest and tax (EBIT) loss is even less appealing. Indeed, it lost US$382m at the EBIT level. Considering that alongside the liabilities mentioned above make us nervous about the company. It would need to improve its operations quickly for us to be interested in it. It's fair to say the loss of US$781m didn't encourage us either; we'd like to see a profit. In the meantime, we consider the stock to be risky. There's no doubt that we learn most about debt from the balance sheet. But ultimately, every company can contain risks that exist outside of the balance sheet. For instance, we've identified 2 warning signs for OCI (1 is concerning) you should be aware of.
If you're interested in investing in businesses that can grow profits without the burden of debt, then check out this free list of growing businesses that have net cash on the balance sheet.
Valuation is complex, but we're helping make it simple.
Find out whether OCI is potentially over or undervalued by checking out our comprehensive analysis, which includes fair value estimates, risks and warnings, dividends, insider transactions and financial health.
View the Free AnalysisHave feedback on this article? Concerned about the content? Get in touch with us directly. Alternatively, email editorial-team (at) simplywallst.com.
This article by Simply Wall St is general in nature. We provide commentary based on historical data and analyst forecasts only using an unbiased methodology and our articles are not intended to be financial advice. It does not constitute a recommendation to buy or sell any stock, and does not take account of your objectives, or your financial situation. We aim to bring you long-term focused analysis driven by fundamental data. Note that our analysis may not factor in the latest price-sensitive company announcements or qualitative material. Simply Wall St has no position in any stocks mentioned.

Simply Wall St
About ENXTAM:OCI
OCI
OCI N.V. produces and distributes hydrogen-based and natural gas-based products to agricultural, transportation, and industrial customers.
Exceptional growth potential with adequate balance sheet.
