Stock Analysis
- India
- /
- Auto Components
- /
- NSEI:ASAL
Further Upside For Automotive Stampings and Assemblies Limited (NSE:ASAL) Shares Could Introduce Price Risks After 41% Bounce
Despite an already strong run, Automotive Stampings and Assemblies Limited (NSE:ASAL) shares have been powering on, with a gain of 41% in the last thirty days. The annual gain comes to 141% following the latest surge, making investors sit up and take notice.
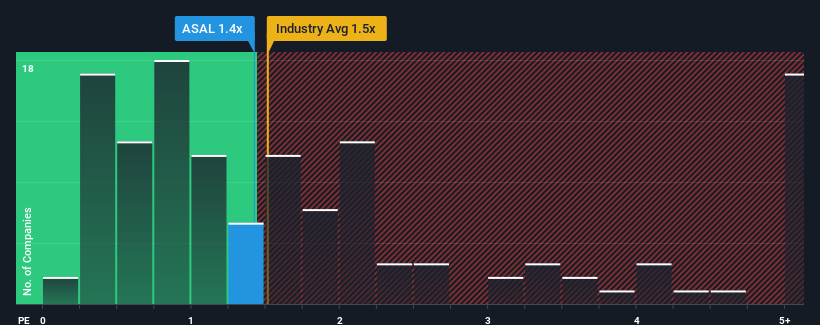
In spite of the firm bounce in price, you could still be forgiven for feeling indifferent about Automotive Stampings and Assemblies' P/S ratio of 1.4x, since the median price-to-sales (or "P/S") ratio for the Auto Components industry in India is also close to 1.5x. However, investors might be overlooking a clear opportunity or potential setback if there is no rational basis for the P/S.
View our latest analysis for Automotive Stampings and Assemblies
What Does Automotive Stampings and Assemblies' P/S Mean For Shareholders?
Revenue has risen at a steady rate over the last year for Automotive Stampings and Assemblies, which is generally not a bad outcome. One possibility is that the P/S is moderate because investors think this good revenue growth might only be parallel to the broader industry in the near future. Those who are bullish on Automotive Stampings and Assemblies will be hoping that this isn't the case, so that they can pick up the stock at a lower valuation.
Want the full picture on earnings, revenue and cash flow for the company? Then our free report on Automotive Stampings and Assemblies will help you shine a light on its historical performance.What Are Revenue Growth Metrics Telling Us About The P/S?
There's an inherent assumption that a company should be matching the industry for P/S ratios like Automotive Stampings and Assemblies' to be considered reasonable.
If we review the last year of revenue growth, the company posted a worthy increase of 4.4%. Pleasingly, revenue has also lifted 212% in aggregate from three years ago, partly thanks to the last 12 months of growth. So we can start by confirming that the company has done a great job of growing revenues over that time.
When compared to the industry's one-year growth forecast of 10%, the most recent medium-term revenue trajectory is noticeably more alluring
In light of this, it's curious that Automotive Stampings and Assemblies' P/S sits in line with the majority of other companies. Apparently some shareholders believe the recent performance is at its limits and have been accepting lower selling prices.
What Does Automotive Stampings and Assemblies' P/S Mean For Investors?
Automotive Stampings and Assemblies appears to be back in favour with a solid price jump bringing its P/S back in line with other companies in the industry Using the price-to-sales ratio alone to determine if you should sell your stock isn't sensible, however it can be a practical guide to the company's future prospects.
We didn't quite envision Automotive Stampings and Assemblies' P/S sitting in line with the wider industry, considering the revenue growth over the last three-year is higher than the current industry outlook. There could be some unobserved threats to revenue preventing the P/S ratio from matching this positive performance. It appears some are indeed anticipating revenue instability, because the persistence of these recent medium-term conditions would normally provide a boost to the share price.
And what about other risks? Every company has them, and we've spotted 4 warning signs for Automotive Stampings and Assemblies (of which 3 don't sit too well with us!) you should know about.
If you're unsure about the strength of Automotive Stampings and Assemblies' business, why not explore our interactive list of stocks with solid business fundamentals for some other companies you may have missed.
Valuation is complex, but we're helping make it simple.
Find out whether Automotive Stampings and Assemblies is potentially over or undervalued by checking out our comprehensive analysis, which includes fair value estimates, risks and warnings, dividends, insider transactions and financial health.
View the Free AnalysisHave feedback on this article? Concerned about the content? Get in touch with us directly. Alternatively, email editorial-team (at) simplywallst.com.
This article by Simply Wall St is general in nature. We provide commentary based on historical data and analyst forecasts only using an unbiased methodology and our articles are not intended to be financial advice. It does not constitute a recommendation to buy or sell any stock, and does not take account of your objectives, or your financial situation. We aim to bring you long-term focused analysis driven by fundamental data. Note that our analysis may not factor in the latest price-sensitive company announcements or qualitative material. Simply Wall St has no position in any stocks mentioned.

Simply Wall St
About NSEI:ASAL
Automotive Stampings and Assemblies
Automotive Stampings and Assemblies Limited engages in the design, development, manufacture, assembly, and sale of sheet metal stampings, welded assemblies, and modules for automotive industry in India.
Questionable track record with worrying balance sheet.
