Stock Analysis
- Sweden
- /
- Hospitality
- /
- OM:EVO
Evolution's (STO:EVO) investors will be pleased with their incredible 809% return over the last five years

We think all investors should try to buy and hold high quality multi-year winners. And we've seen some truly amazing gains over the years. To wit, the Evolution AB (publ) (STO:EVO) share price has soared 759% over five years. This just goes to show the value creation that some businesses can achieve. Also pleasing for shareholders was the 14% gain in the last three months. But this move may well have been assisted by the reasonably buoyant market (up 8.1% in 90 days). We love happy stories like this one. The company should be really proud of that performance!
So let's assess the underlying fundamentals over the last 5 years and see if they've moved in lock-step with shareholder returns.
Check out our latest analysis for Evolution
To quote Buffett, 'Ships will sail around the world but the Flat Earth Society will flourish. There will continue to be wide discrepancies between price and value in the marketplace...' By comparing earnings per share (EPS) and share price changes over time, we can get a feel for how investor attitudes to a company have morphed over time.
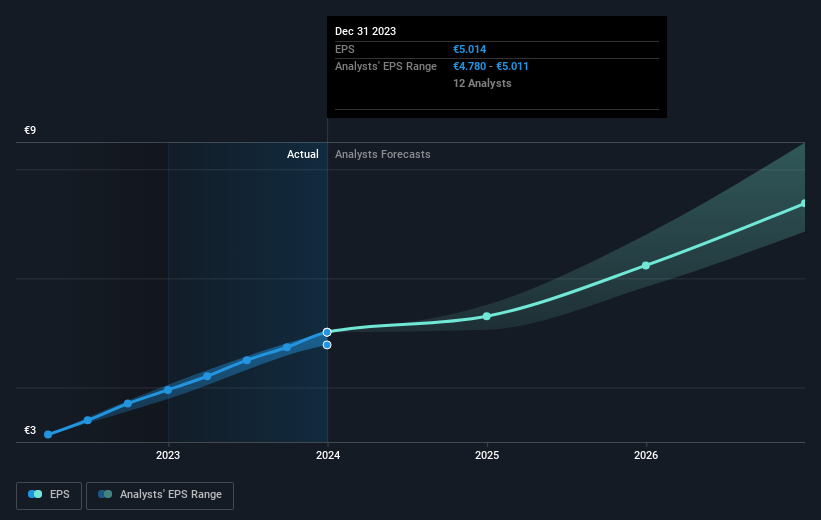
During five years of share price growth, Evolution achieved compound earnings per share (EPS) growth of 61% per year. This EPS growth is reasonably close to the 54% average annual increase in the share price. This indicates that investor sentiment towards the company has not changed a great deal. Indeed, it would appear the share price is reacting to the EPS.
You can see below how EPS has changed over time (discover the exact values by clicking on the image).
We consider it positive that insiders have made significant purchases in the last year. Even so, future earnings will be far more important to whether current shareholders make money. It might be well worthwhile taking a look at our free report on Evolution's earnings, revenue and cash flow.
What About Dividends?
As well as measuring the share price return, investors should also consider the total shareholder return (TSR). The TSR is a return calculation that accounts for the value of cash dividends (assuming that any dividend received was reinvested) and the calculated value of any discounted capital raisings and spin-offs. Arguably, the TSR gives a more comprehensive picture of the return generated by a stock. We note that for Evolution the TSR over the last 5 years was 809%, which is better than the share price return mentioned above. This is largely a result of its dividend payments!
A Different Perspective
Evolution shareholders are down 2.6% for the year (even including dividends), but the market itself is up 13%. Even the share prices of good stocks drop sometimes, but we want to see improvements in the fundamental metrics of a business, before getting too interested. Longer term investors wouldn't be so upset, since they would have made 56%, each year, over five years. If the fundamental data continues to indicate long term sustainable growth, the current sell-off could be an opportunity worth considering. It's always interesting to track share price performance over the longer term. But to understand Evolution better, we need to consider many other factors. Take risks, for example - Evolution has 1 warning sign we think you should be aware of.
There are plenty of other companies that have insiders buying up shares. You probably do not want to miss this free list of growing companies that insiders are buying.
Please note, the market returns quoted in this article reflect the market weighted average returns of stocks that currently trade on Swedish exchanges.
Valuation is complex, but we're helping make it simple.
Find out whether Evolution is potentially over or undervalued by checking out our comprehensive analysis, which includes fair value estimates, risks and warnings, dividends, insider transactions and financial health.
View the Free AnalysisHave feedback on this article? Concerned about the content? Get in touch with us directly. Alternatively, email editorial-team (at) simplywallst.com.
This article by Simply Wall St is general in nature. We provide commentary based on historical data and analyst forecasts only using an unbiased methodology and our articles are not intended to be financial advice. It does not constitute a recommendation to buy or sell any stock, and does not take account of your objectives, or your financial situation. We aim to bring you long-term focused analysis driven by fundamental data. Note that our analysis may not factor in the latest price-sensitive company announcements or qualitative material. Simply Wall St has no position in any stocks mentioned.

Simply Wall St
About OM:EVO
Evolution
Evolution AB (publ) develops, produces, markets, and licenses online casino systems to gaming operators in Europe, Asia, North America, Latin America, and internationally.
Flawless balance sheet with solid track record.
